
Figure 3. Pairwise intra- and inter-kingdom interactions drive predictable patterns of infant microbiome assembly.
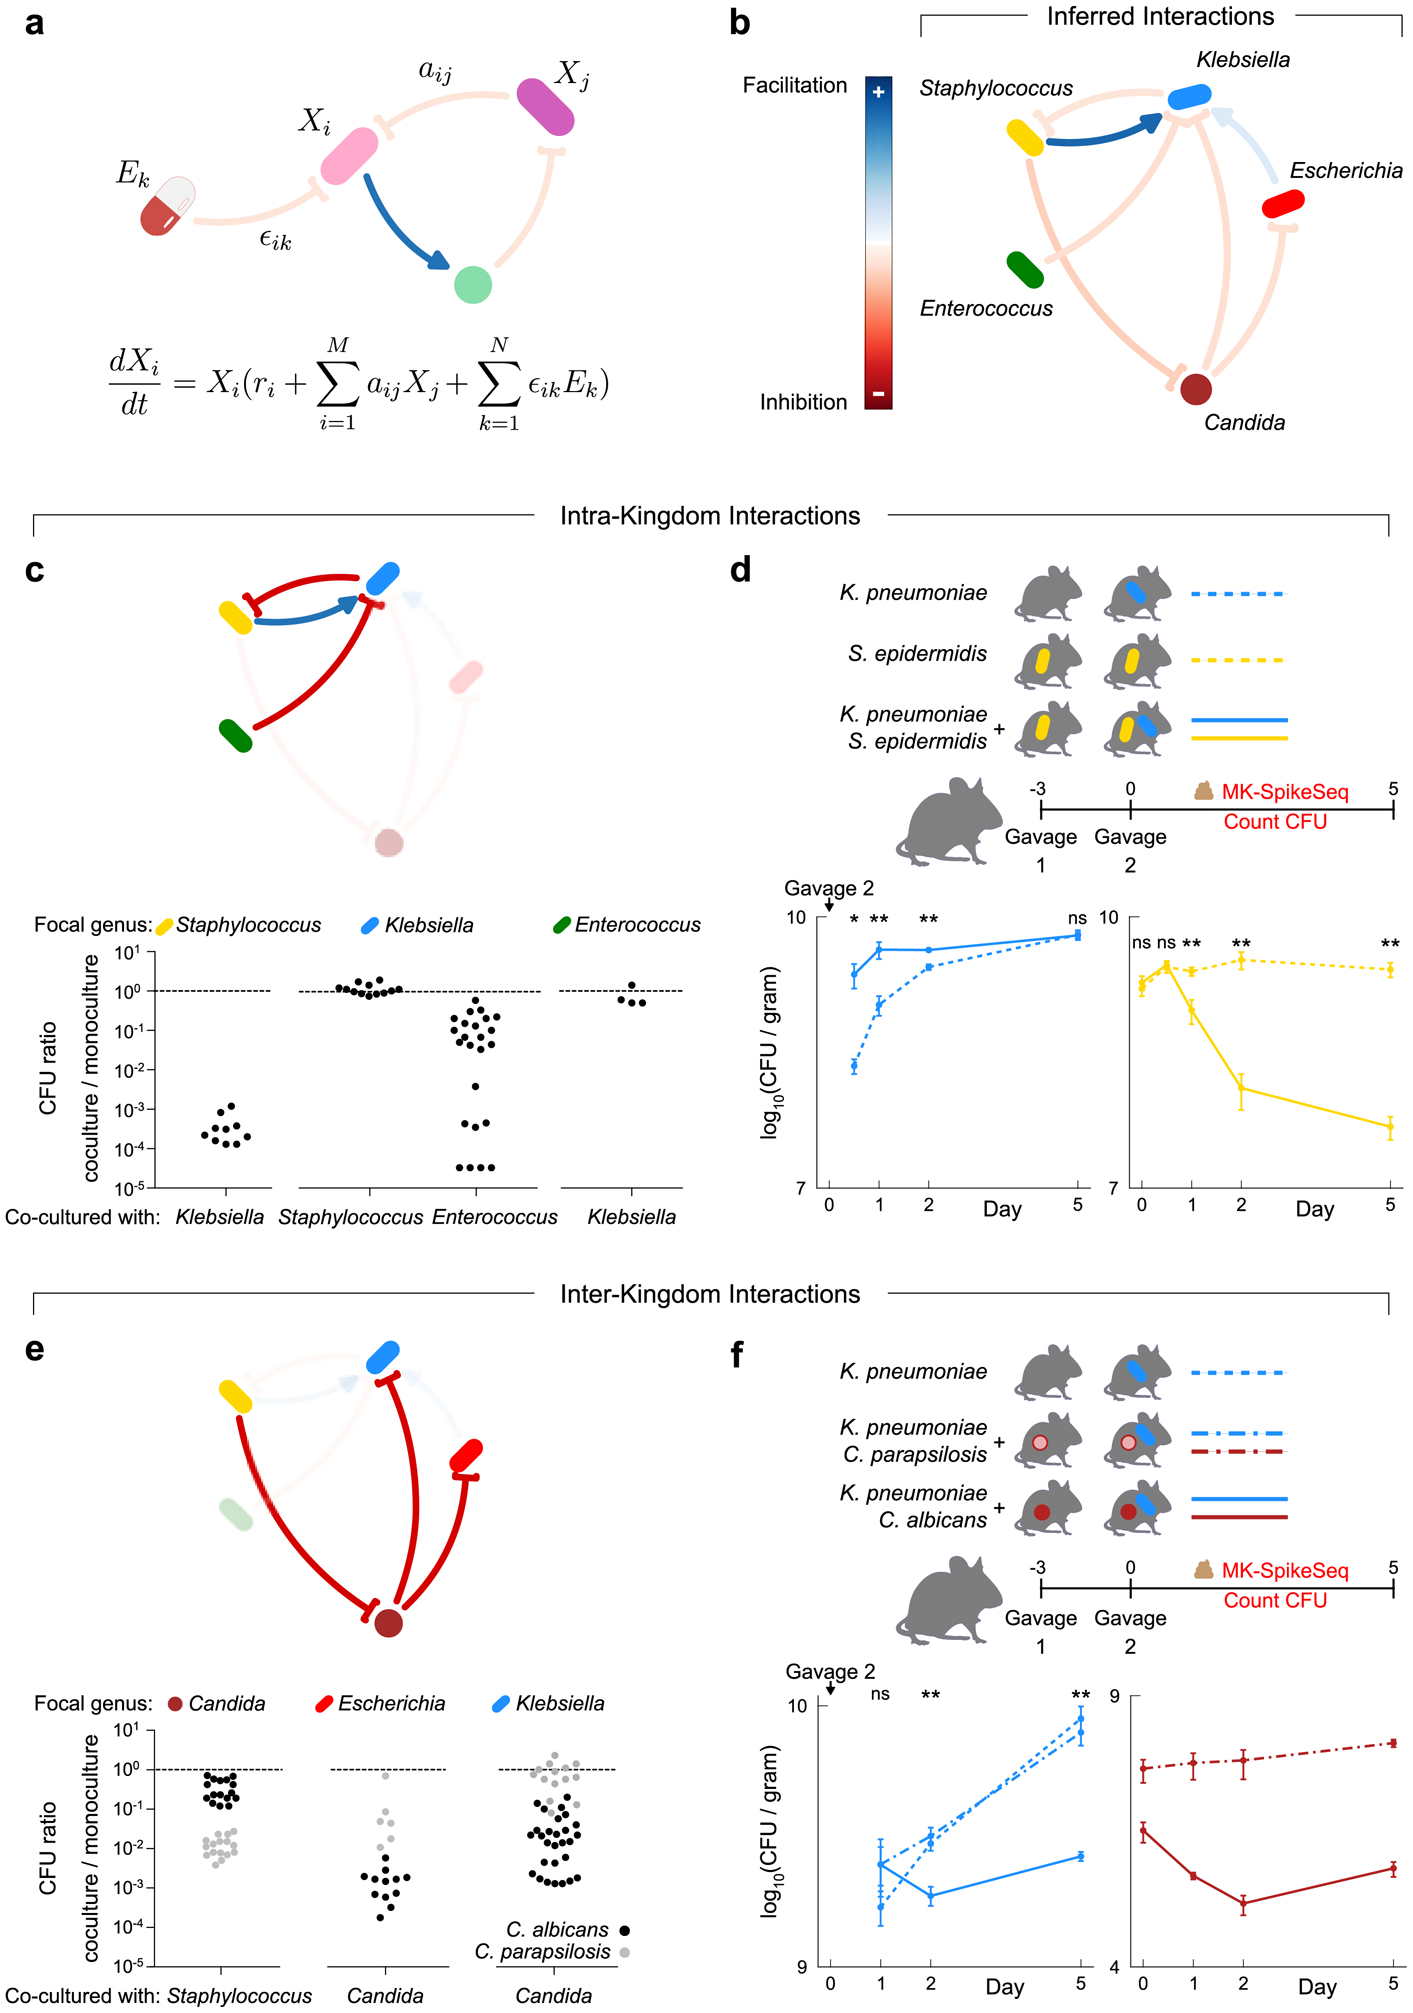
a, Schematic illustrating the generalized Lotka-Volterra (gLV) model used to identify causative drivers of bacterial and fungal dynamics within the infant gut. This model assumes the growth rate of each taxon, is determined by its own intrinsic growth rate ri, its interaction with other community members aijXj, and any environmental perturbation ϵikEk. b, The gLV model identified a network of microbe-microbe interactions occurring between dominant members of the preterm gut that are predicted to affect microbiota dynamics. c, in vitro growth effects of infant isolates upon one another using monoculture and pairwise co-culture, testing the predicted within-kingdom interactions. d, CFU counts quantifying microbial fitness in vivo in a specific pathogen free (SPF) mouse model, reproducing the predicted exploitation of Staphylococcus by Klebsiella. Gavage 2 indicates day of inoculation with K. pneumoniae. e, in vitro growth of infant isolates when growing alone and in co-culture, testing the predicted cross-kingdom interactions. Black and grey dots indicate co-cultures with C. albicans and C. parapsilosis respectively. f, CFU counts quantifying microbial fitness in vivo in a SPF mouse model, reproducing the species-specific differences in the cross-kingdom inhibition observed in vitro. Gavage 2 indicates day of inoculation with K. pneumoniae. For panels c/e: each dot denotes one unique pair of strains of the indicated genera, with each pair replicated at least once (Supplemental Table 14a). For panels d/f: Klebsiella was undetected at time 0 upon gavage; n=5 per group, error bars denote the SEM; * p<0.05, ** p<0.01, ns not significant, by two-tailed student’s t test; see Supplemental Table 15 for exact p-values; see repeat in vivo experiments in Extended Data Fig 10c–d.