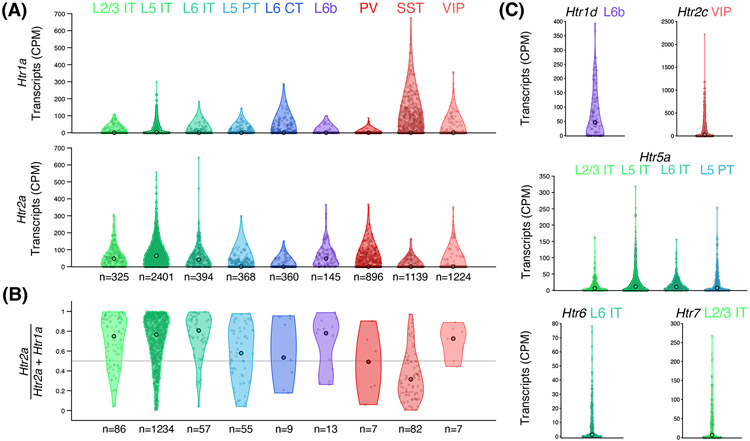
Figure 3. Cell-type differences in the expression of Htr1a, Htr2a, and other serotonin receptor genes in the adult mouse frontal cortex.
(A) Expression of Htr1a and Htr2a transcripts in cortical cell types, based on analyzing single-cell RNA sequencing (SMART-Seq v4) data from 7,252 neurons sampled from the anterolateral motor cortex of adult C57BL/6J mice of both sexes by the Allen Institute for Brain Science [95]. Open circle, median value. n, count of the cell subclass. (B) The Htr2a:Htr1a expression ratio, for neurons with non-zero expression values for both Htr1a and Htr2a. Open circle, median value. n, count of the cell subclass. (C) Additional serotonin receptor subtypes (among those listed in Table 1) that show enriched expression (median CPM > 0) in select neuronal subclasses. Abbreviations: CPM, counts per million reads; L2/3, layer 2/3; L5, layer 5; L6, layer 6; IT, intratelencephalic; PT, pyramidal tract; CT, corticothalamic; PV, parvalbumin; SST, somatostatin; VIP, vasoactive-intestinal protein.

