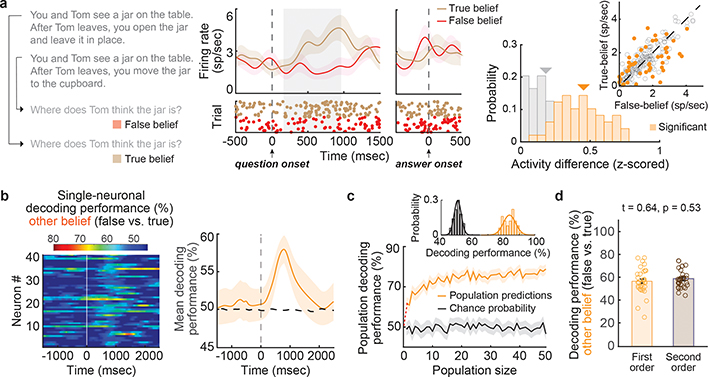
Figure 2. |. Single-neuronal predictions of another’s true and false beliefs.
a, Representative narrative and question examples for false- vs. true-belief trials are shown to the left. In the middle is a peri-stimulus time histogram (± s.e.m.) and raster reflecting the spiking activity of a representative neuron during questioning. On the right, the firing rates (inset) and z-scored activities for neurons that displayed significant modulation (n = 49) are in orange and those that did not (n = 163) are in gray. b, A linear discriminant quantified the degree to which the activities of individual neurons were predictive of false-belief vs. true-belief trials on a trial-by-trial basis (left, n = 49; one-sided permutation test, p < 0.025). The right traces illustrate the time course of the mean decoding performance with 95% CL. c, Mean and cumulative decoding performances for the population of neurons (n = 49) with their 95% CL. d, Single-neuronal decoding performances (mean ± s.e.m., n = 32 neurons) during first-order and second-order false- vs. true-belief trials (n = 4 participants) were similar (two-sided paired t-test, p = 0.53). Similar results were obtained when considering mean firing rates (1.47 ± 0.12 vs. 1.49 ± 0.12 spike/sec; two-sided rank-sum test: z-value = 0.05, p = 0.96), respectively.

