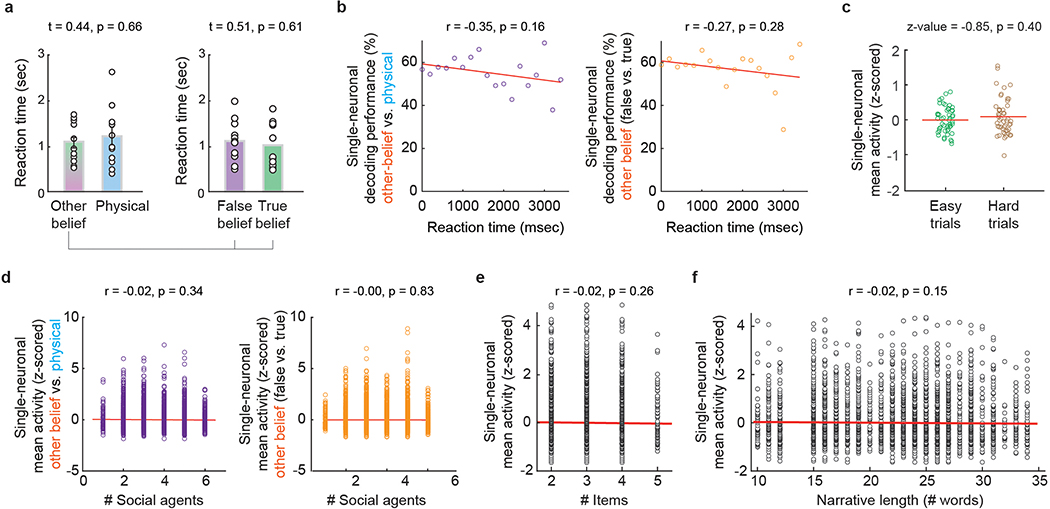
Extended Data Figure 5 |. Robustness of belief representations.
a, Reaction times (mean ± s.e.m.) from question offset to answer onset during the primary task conditions across participants (n = 11) were similar for other-belief vs. physical trials (1071 ± 135 vs. 1178 ± 201 msec) and for false- vs. true-belief trials (1130 ± 136 vs. 1028 ± 147 msec). The p-values obtained using a two-sided unpaired t-test. b, To evaluate how differences in neuronal decoding may relate to answer response time, decoding performances were first averaged across neurons that displayed significant selectivity and then sorted based on the participants’ reaction times (n = 18 time points). There was a slightly negative but non-significant correlation between RTs and decoding performances both when comparing other-belief to physical trials (r = −0.35, p = 0.16) and when comparing other false- to true-belief trials (r = −0.27, p = 0.28). The p-values by Spearman’s correlation test are shown. c, We found no relationship between neuronal activity (mean firing rates, n = 49 neurons) and trial difficulty (easy vs. hard; Methods) based on the participants’ overall performances (two-sided rank-sum test, z-value = 0.85, p = 0.40). d,e,f, Neuronal activity was evaluated based on (d) the number of social agents presented to the participants (left: n = 4024 trials, right: n = 4527 trials), (e) the number of items (e.g., table, jar, cupboard, etc.) that had to be held in working memory prior to questioning (n = 4527 trials), and (f) the narrative length based on the number of words (n = 4527 trials). Activities were z-scored by removing the mean and dividing by the standard deviation. A lack of relation was demonstrated by correlation analysis in each condition (Pearson’s correlation, p > 0.1).

