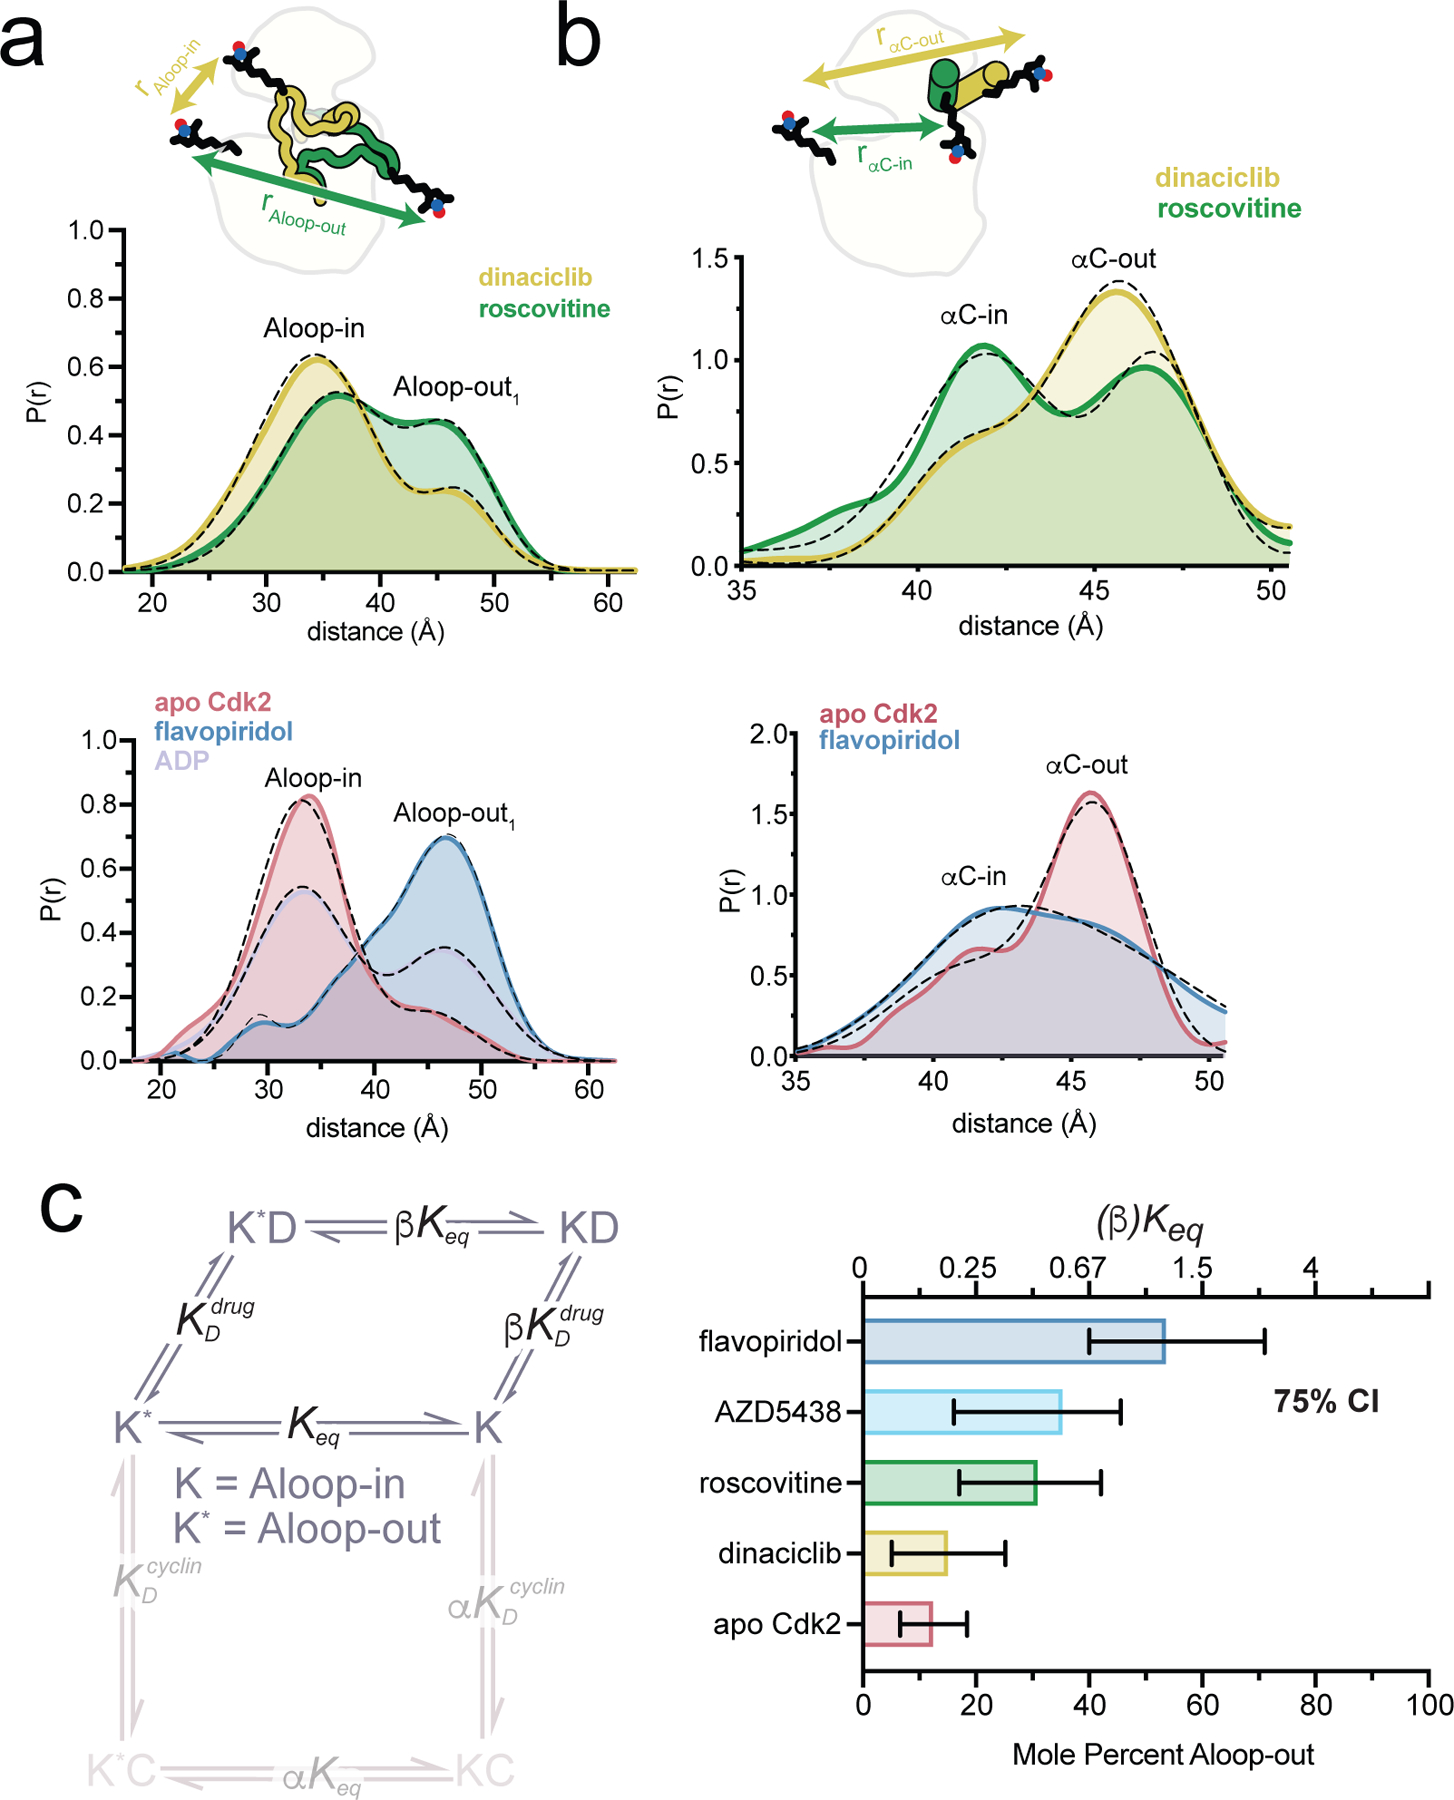
Figure 3. Cdk2 inhibitors drive conformational shifts upon binding.

a, b) DEER experiments tracking the A-loop (a) and αC-helix (b). Tikhonov-derived distance distributions are shown for monomeric Cdk2 bound to either dinaciclib or roscovitine (top) and to flavopiridol (bottom). For the A-loop experiments data are also shown for Cdk2 bound to ADP (bottom). Dashed black lines represent the Gaussian fits to the DEER data. Peak assignments are based on spin-spin distance calculations. The spin labeling schemes are represented schematically at the top. Data for AZD5438 are shown in Supplementary Fig. 5 and 6. c) Allosteric two-state model for inhibitor binding to Cdk2, with K and K* representing the Aloop-in and Aloop-out states of the kinase, D representing the drug/inhibitor, Keq the Aloop-in/out equilibrium constant, and and the microscopic equilibrium constants for inhibitor binding to Aloop-out and Aloop-in states, respectively. The coupling parameter β describes the fold change in Keq upon inhibitor binding. The bar graph summarizes the values of Keq and β derived from Gaussian fits of the A-loop DEER data. Error bars represent 75% confidence intervals, calculated from 50,000 simulations of Gaussian fits to the primary data.
