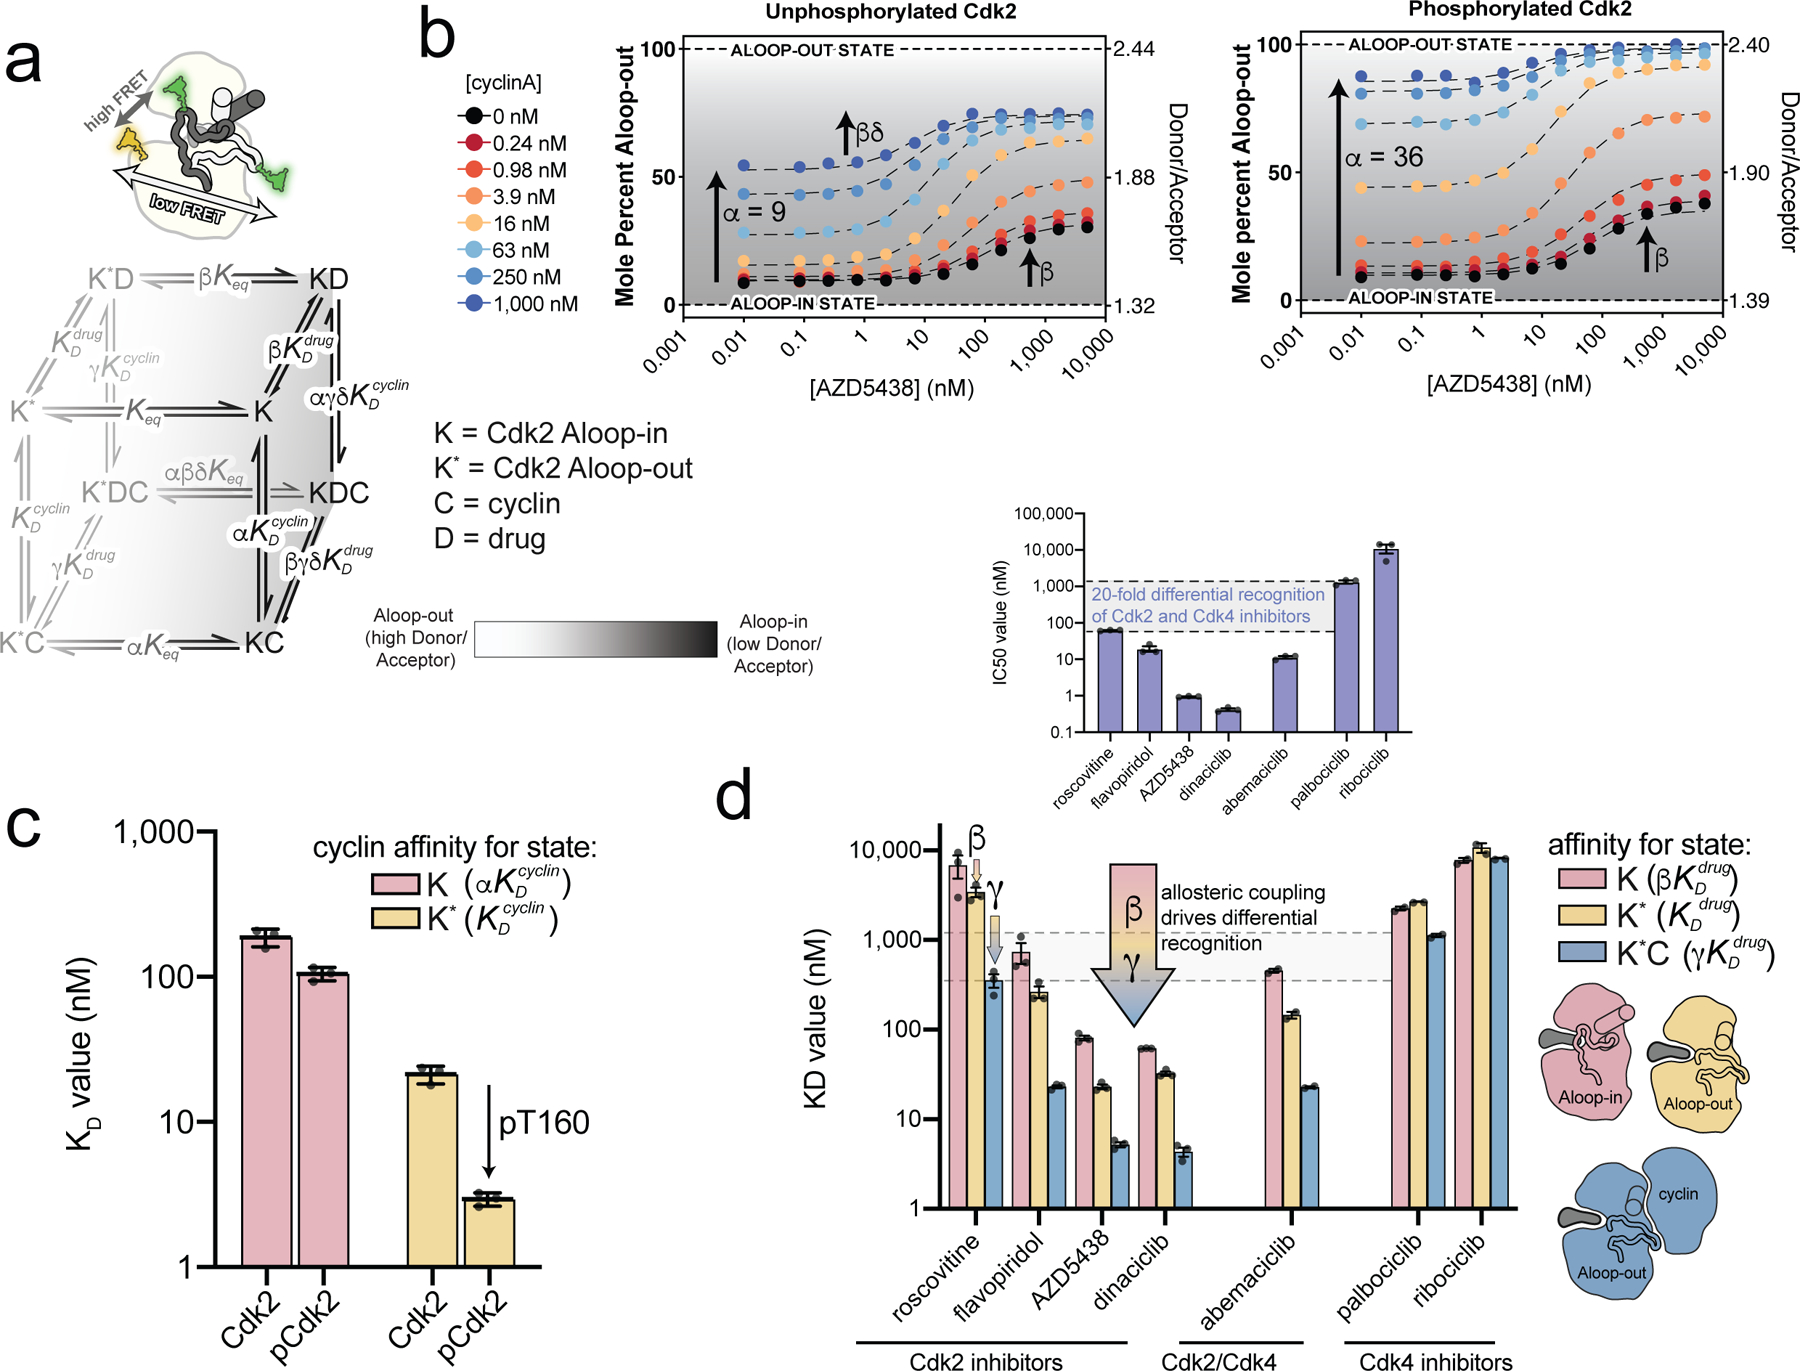
Figure 4. Tight binding of Cdk2 inhibitors arises from allosteric coupling with the cyclin subunit.

a) A schematic of the FRET sensor is shown above the allosteric model used to fit the FRET data. The model describes the binding of cyclin and inhibitor to the Aloop-in and Aloop-out states, with representing the Aloop-in/out equilibrium, and representing microscopic equilibrium constants for cyclin and inhibitor binding to the Aloop-out state, and the allosteric coupling described with parameters α, β, γ, δ. The Aloop-in/out equilibrium is represented as a gray scale. b) FRET measurements for AZD5438 binding to Cdk2 (left) and phosphorylated pCdk2 (right) at different cyclinA concentrations. The black dashed lines are the global fit to the allosteric model shown in a. The FRET values are shown on the right ordinate and the corresponding values of the conformational equilibrium on the left ordinate. Data for all inhibitors are shown in Supplementary Fig. 8. c) Microscopic equilibrium constants for cyclin binding to Aloop-in ( and Aloop-out states of unphosphorylated and phosphorylated Cdk2. Values are mean ± S.E.M; n = 3 independent experiments. d) Microscopic equilibrium constants for inhibitor binding to three different structural states of phosphorylated Cdk2. The arrow represents the allosteric coupling effects that drive cooperative binding of inhibitor and cyclin. Values are mean ± S.E.M; n = 3 independent experiments. Corresponding data for the unphosphorylated kinase are shown in Supplementary Fig. 9. The inset shows IC50 values determined for the same set of inhibitors using phosphorylated pCdk2:cyclinA dimer.
