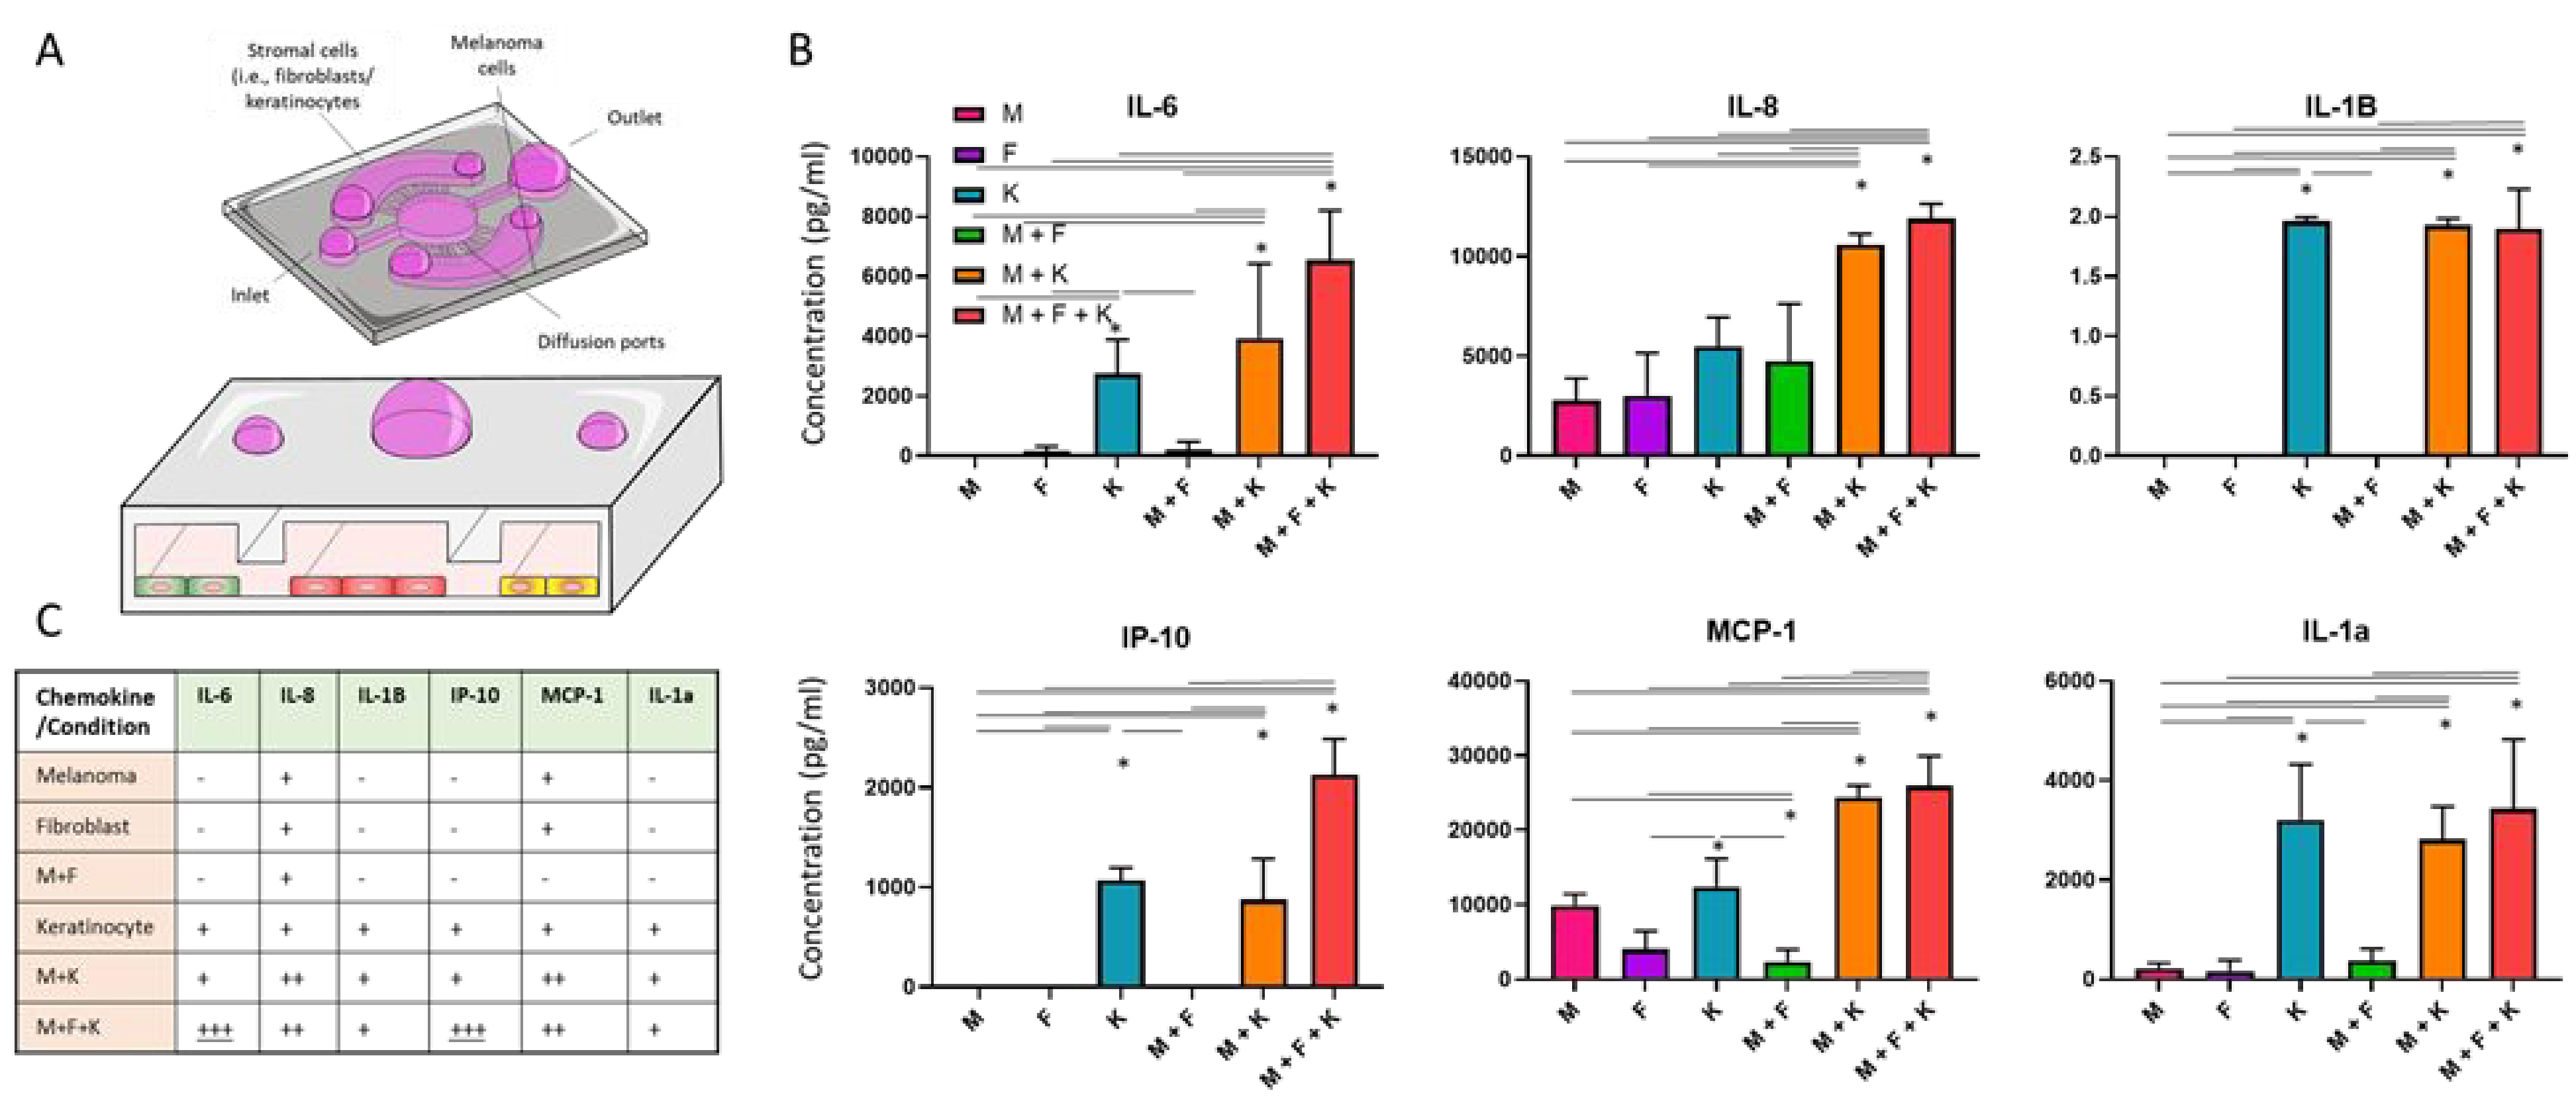
Figure 3. Cellular cross-talk.

A) Melanoma cells were seeded in the central chamber alone or with dermal fibroblasts and/or keratinocytes on the lateral chambers. After 3days, chemokine secretion was analyzed by MAGPIX.B) Bar graphs showed the chemokine secretion in melanoma cells alone (M), dermal fibroblasts alone (F), keratinocytes alone (K), melanoma with dermal fibroblasts (M + F), melanoma cells and keratinocytes (M + K), and the triple co-culture (M + F + K). C) Table summarizes the trends observed. “–“ denotes low/no expression; “+” denotes expression detected; “++” denotes higher expression compared with “+” but it is compatible with an additive increase; “+++” denotes higher expression than additive increase. Asterisks denote p-value<0.05. Experiments were repeated at least three independent times with replicates showing showed similar trends.
