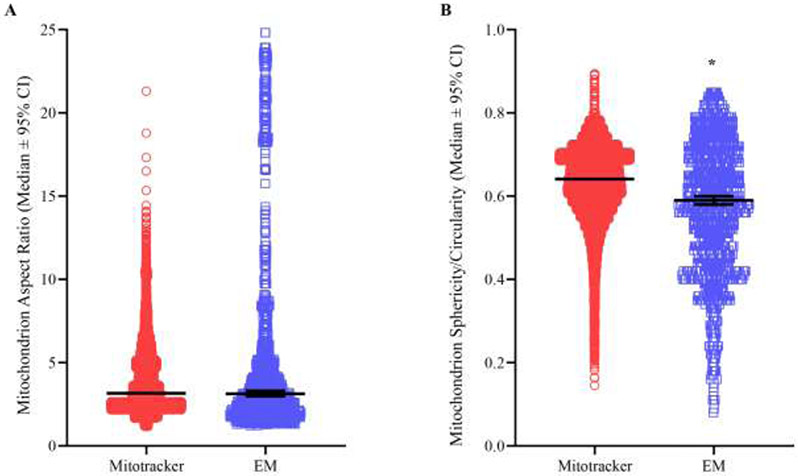
Figure 10: Mitochondrion morphology.
A Scatter-plot (median ± 95% CI) shows no difference in the aspect ratios of individual mitochondrial elements (P=0.13; Mann Whitney U-test) when comparing fluorescent (3.80 ± 0.02, median=3.17, n=23158) to EM techniques (5.96 ± 0.02, median=5.59, n=1285). B Scatter plot (median ± 95% CI) shows a significant (P<0.0001; Mann Whitney U-test) yet small magnitude (<8%) reduction in sphericity/circularity of individual mitochondrial elements when assessed with EM techniques (0.58 ± 0.01, median=0.59, n=1285) compared to MitoTracker Red fluorescent (0.63 ± 0.001, median=0.64, n=23158) methods.

