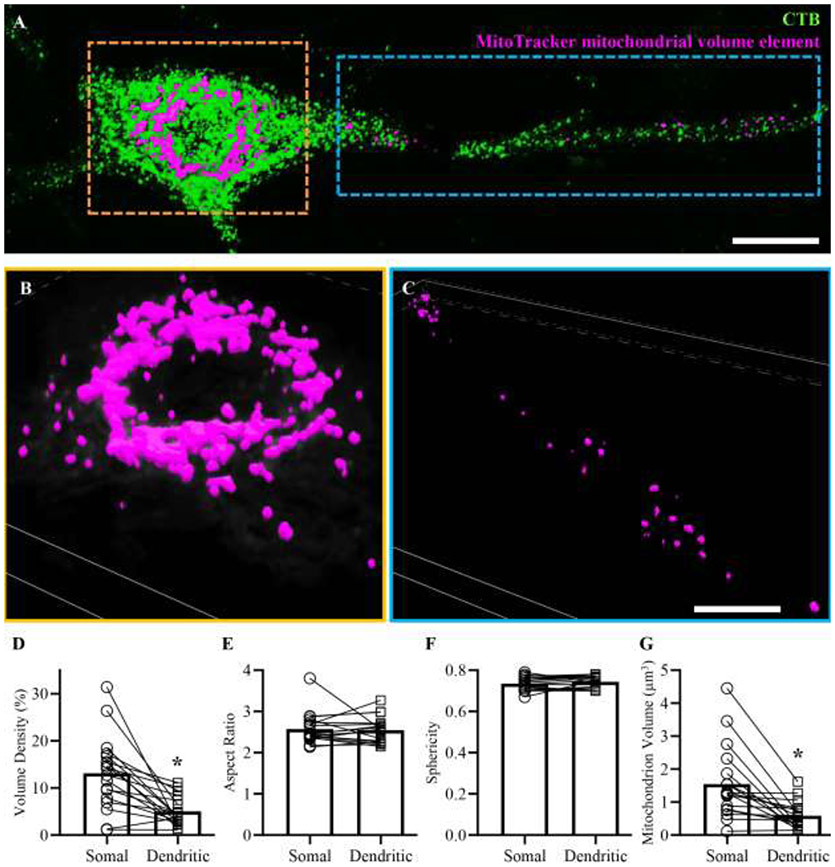
Figure 11: MitoTraker assessment of mitochondrial volumes in somal and dendritic compartments.
A shows a phrenic motor neuron and a portion of the dendritic tree (labelled with CTB, green) superimposed with mitochondrial volume elements (fuchsia). These mitochondrial volume elements were created from 3D reconstructions of deconvolved MitoTracker signal within a somal (B) and dendritic (C) region of interest from the same cell. D shows reduced mitochondrial volume density within the dendritic compartment compared to the soma (P=0.0004, Student’s paired t-test). E shows unchanged mitochondrial aspect ratios within the dendritic compartment compared to the soma (P=0.56, Wilcoxon test). F shows unchanged mitochondrial sphericity within the dendritic compartment compared to the soma (P=0.17, Student’s paired t-test). G shows a reduction in the volume of individual mitochondrial elements within the dendritic compartment compared to the soma (P<0.0001, Wilcoxon test.). Scale Bar: A=13 μm, B and C=8 μm.

