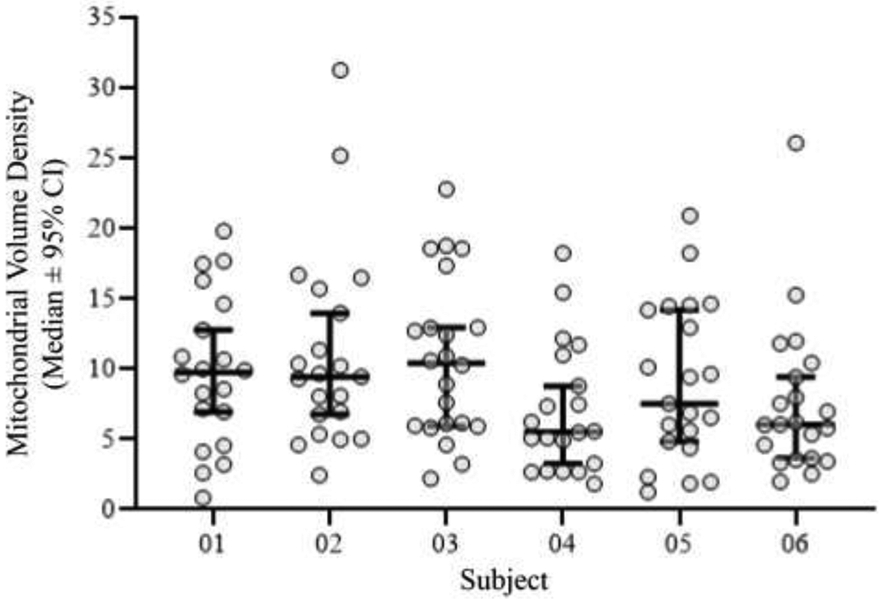
Figure 13: Mitochondrial volume density assessed by MitoTracker Red fluorescence is reliable and repeatable across subjects.

The range of mitochondrial volume densities within labeled phrenic motor neurons in rats was ~1-29%. Scatter-plot (median ± 95% CI) shows that there was no difference in the mean mitochondrial volume density for phrenic motor neurons when compared between rats, with mean values ranging from ~7.5-11% and medians ranging from ~6-10% volume density (P=0.18; Kruskal-Wallis test).
