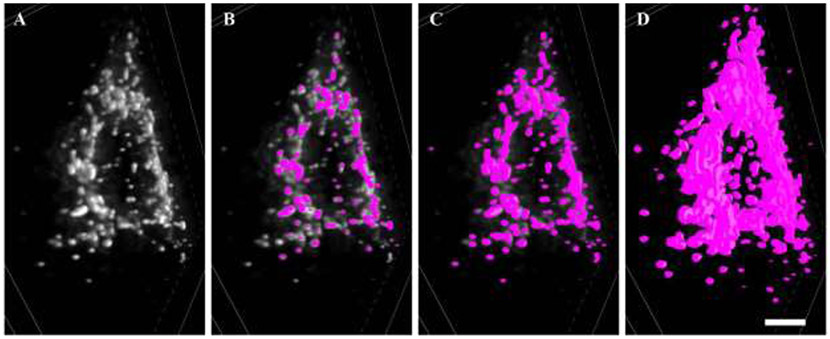
Figure 4: Thresholding of MitoTracker Red.
A shows a 3D z-projection of deconvolved MitoTracker Red signal within a phrenic motor neuron. B Under-thresholding of deconvolved MitoTracker Red signal, with an abundance of signal uncaptured by the binarisation (fuchsia). C shows an acceptable thresholding of deconvolved MitoTracker Red signal, with an abundance of discrete elements and no intense fluorescence outside the binarised volumes. D shows an overly inclusive thresholding of deconvolved MitoTracker Red signal, where excessive enlargement of volumes and many superfused elements becoming indistinguishable from one another. Scale Bar: 3 μm.

