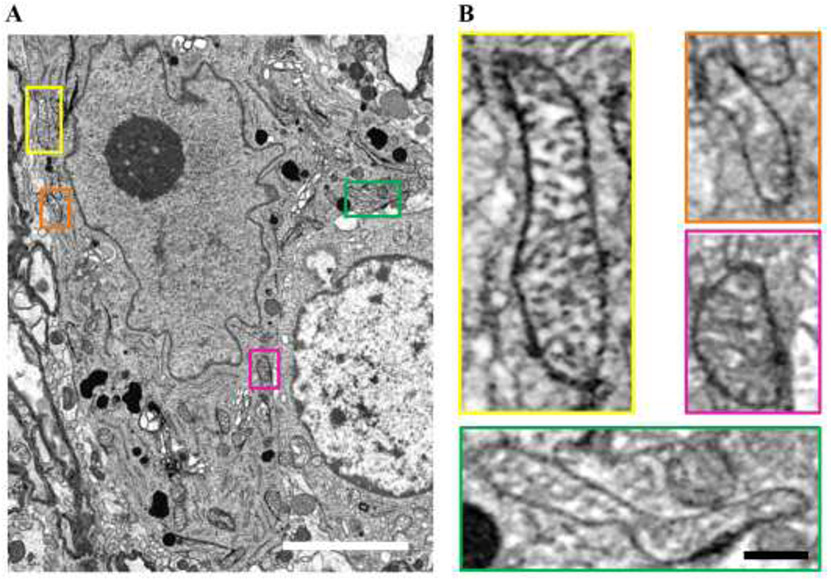
Figure 7: Mitochondria assessment using EM.
A EM blockface image showing a putative phrenic motor neuron, with a prominent nucleolus (dark circle) within the nucleus and a plethora of mitochondria located in perinuclear areas. B Insets show higher-magnification images of mitochondria, color coded to location. Note the example of two adjacent mitochondria in the orange inset contrasted with the long filamentous shape mitochondrion in the green inset. It is highly likely in the case of the former that our fluorescent technique does not discriminate between the two individual mitochondria observed in the orange inset. Scale Bars: A=3 μm; Insets=300 nm.

