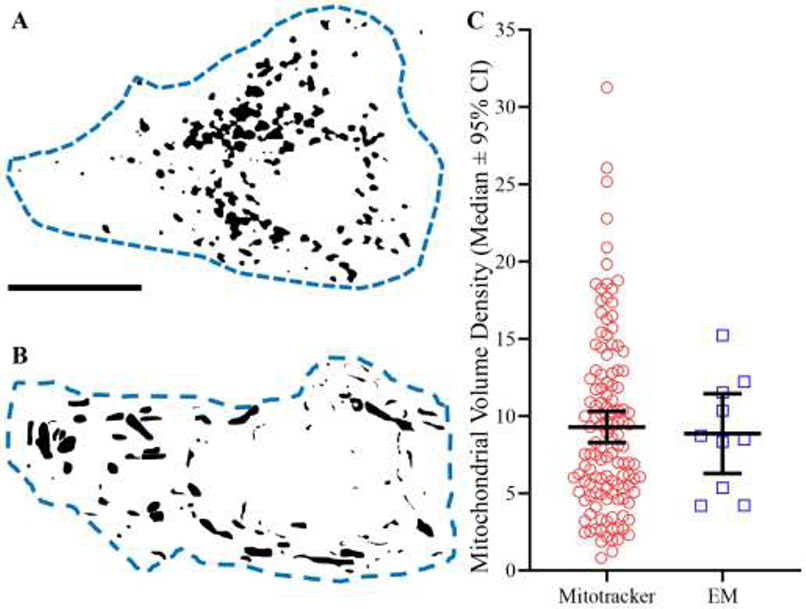
Figure 8: Mitochondrial volume density.
A Silhouette of mitochondrial elements based on deconvolved and binarised MitoTracker Red fluorescence within an identified phrenic motor neuron (dashed blue line). B Silhouette of mitochondria traced over serial blockface EM samples within a putative phrenic motor neuron (dashed blue line). C Scatter-plot (median ± 95% CI) showing no difference in mitochondrial volume density estimates between MitoTracker Red (red circles, n=125) and serial blockface EM (blue squares, n=10) techniques (P=0.91; Mann Whitney U-test). Scale Bar: 5 μm.

