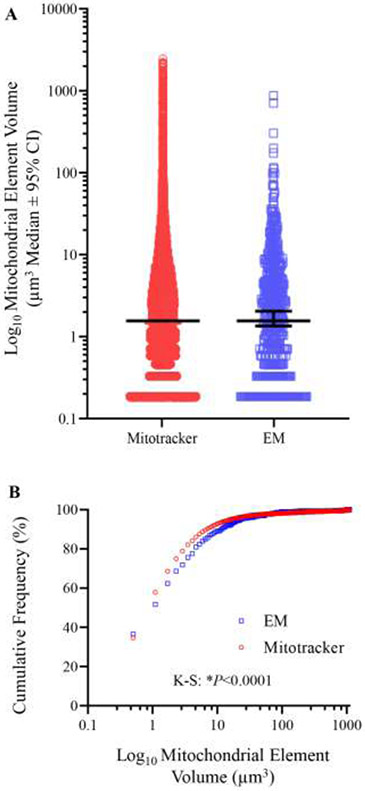
Figure 9: Mitochondrion volumes.
A We observed no difference in the volume estimates of individual mitochondria based on the analysis of either deconvolved MitoTracker Red signal (n=23158) or on Calvalieri volume estimates of serial blockface EM samples (n=1285) are plotted on a Log10 scale (P=0.62; Mann Whitney U-test). B Cumulative frequency plot showing the propensity of EM analysis to observe smaller individual mitochondrion volumes (P<0.0001, Kolmogorov-smirnov test).

