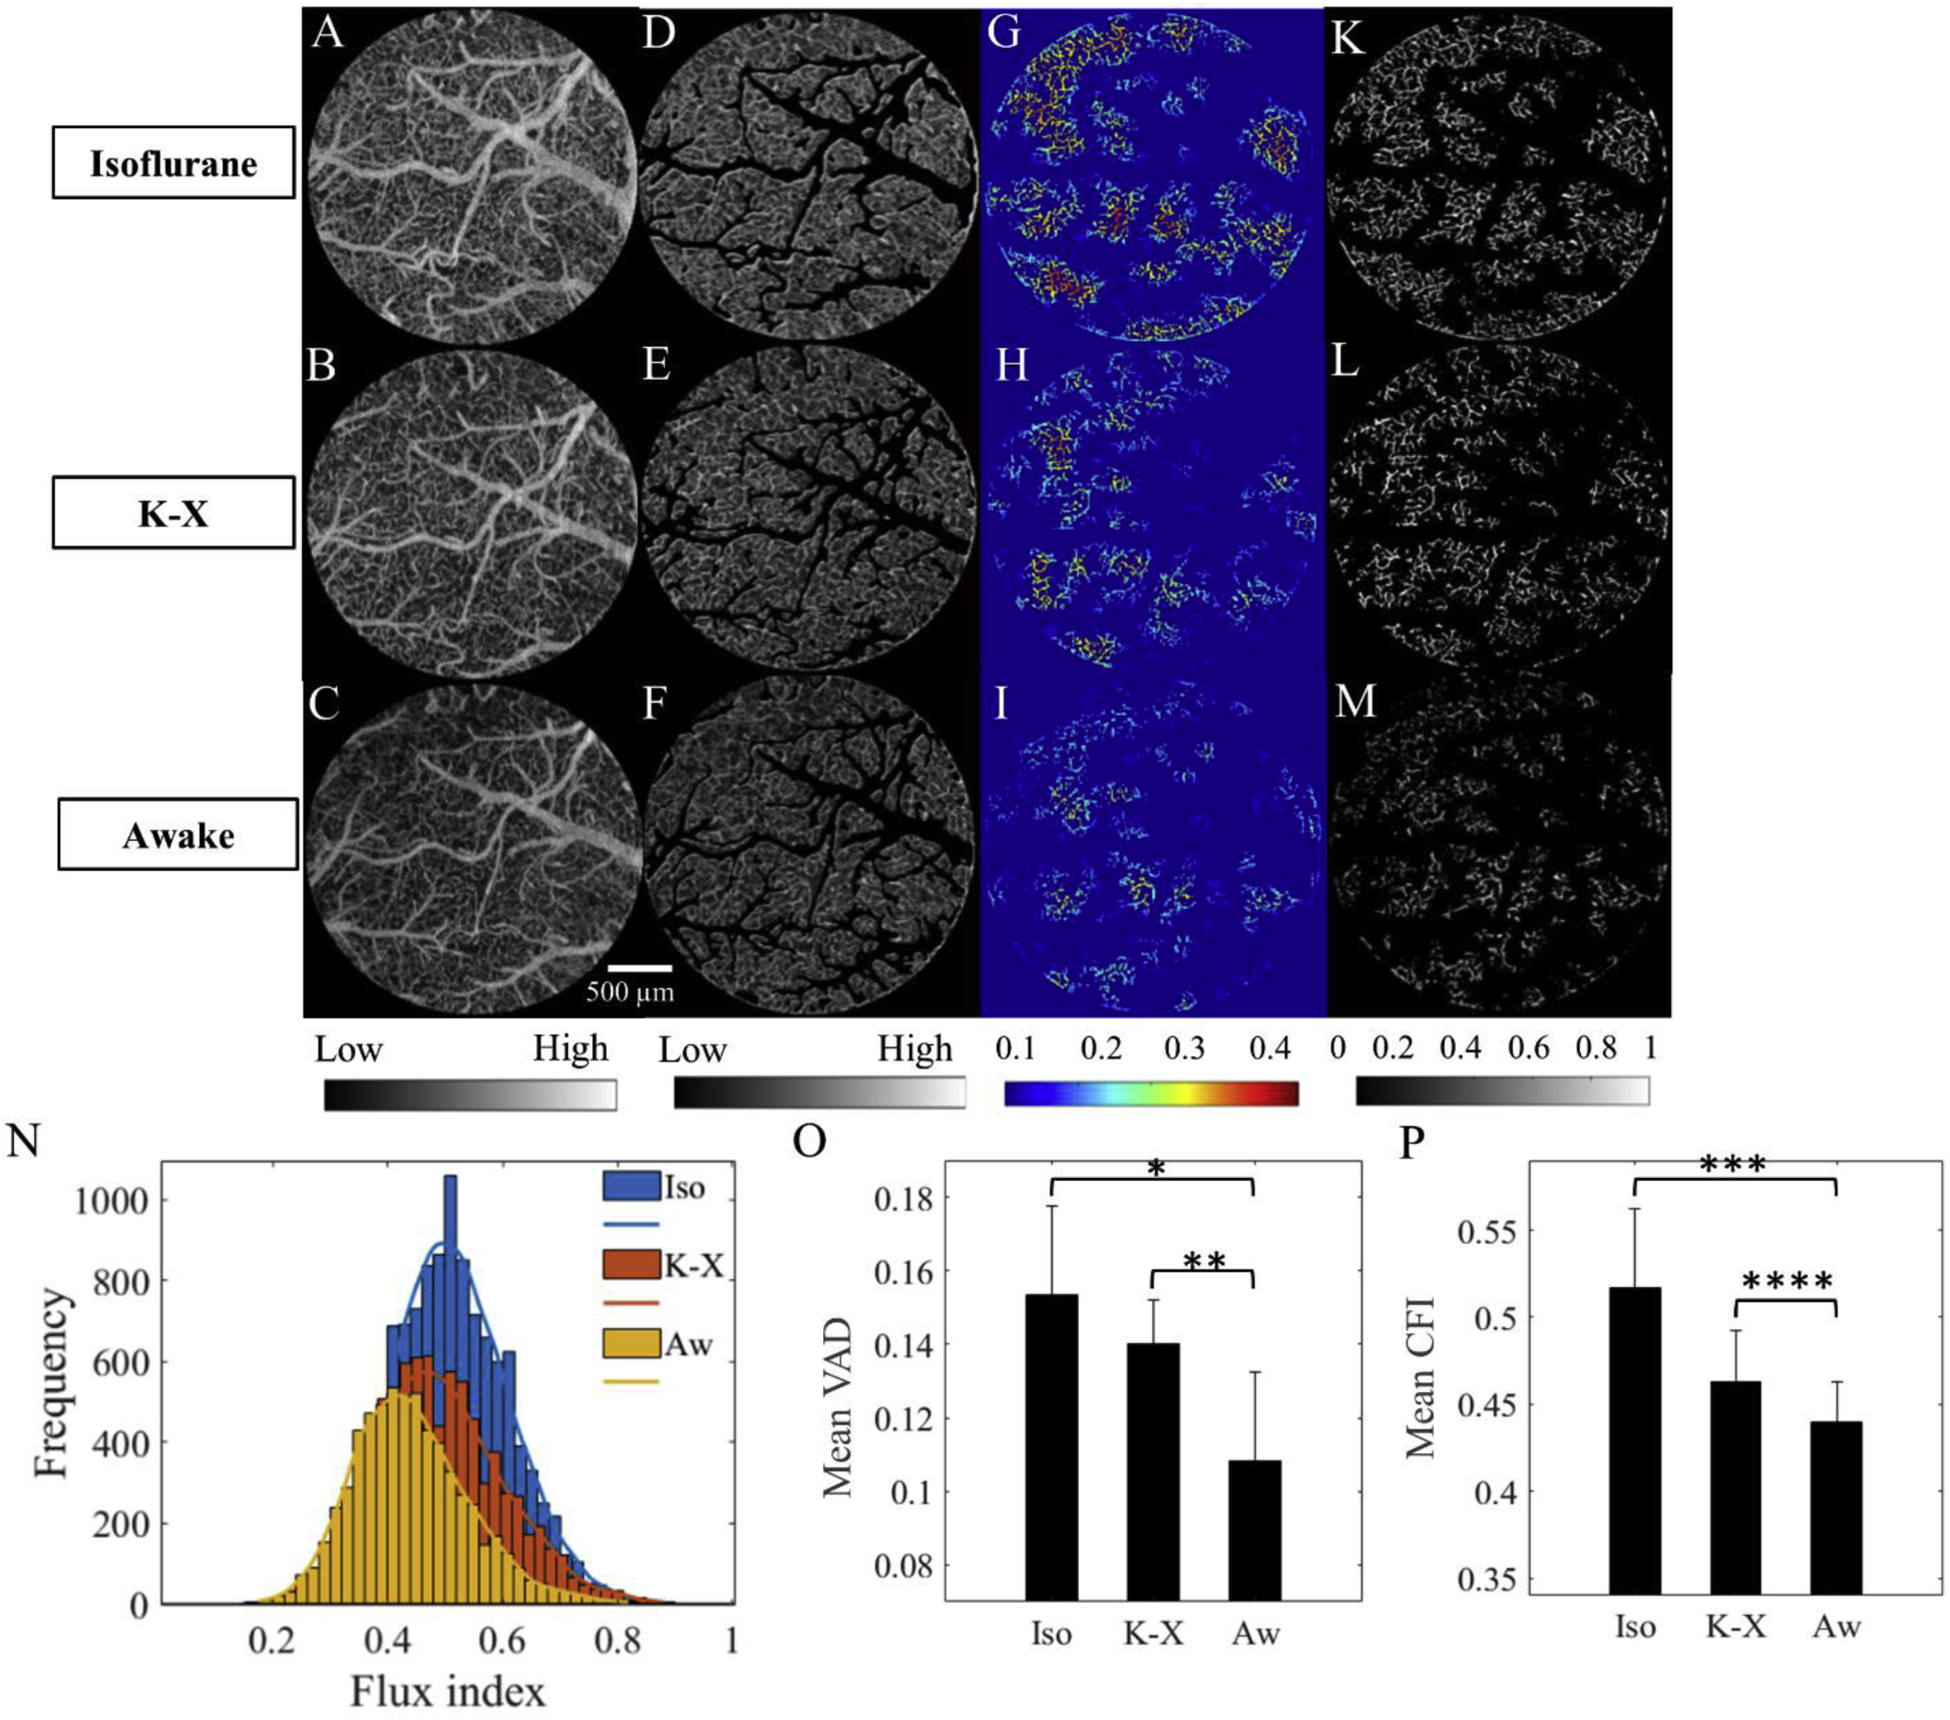
Figure 3.

Comparison of VAD and flux in capillaries. A-C. OMAG angiograms corresponding to isoflurane, ketamine- xylazine, and awake states, respectively, obtained from enface MIP of 3-D OMAG datasets within a 50–300 μm slab. Color bar represents low and high intensity signal. D-F. OMAG angiograms with arteries and veins excluded. G-I. Capillary VAD maps at three states. Color bar represents local white pixels ratio where blue is smaller, and red is larger. K-M. CFI maps at three states. Color bar represents the intensity signal in the range from 0 to 1. N. Capillary flux histogram distributions at three states fitted to Kernel distribution. O. Comparison of mean VAD among three states. *pvalue=0.0065, **p-value=0.0368. P. Comparison of mean CFI among three states. ***p-value=0.0131, ****p-value=0.0369. The values are mean ± std. (standard deviation of group mean, N=6 animals per group).
