
Figure 6.
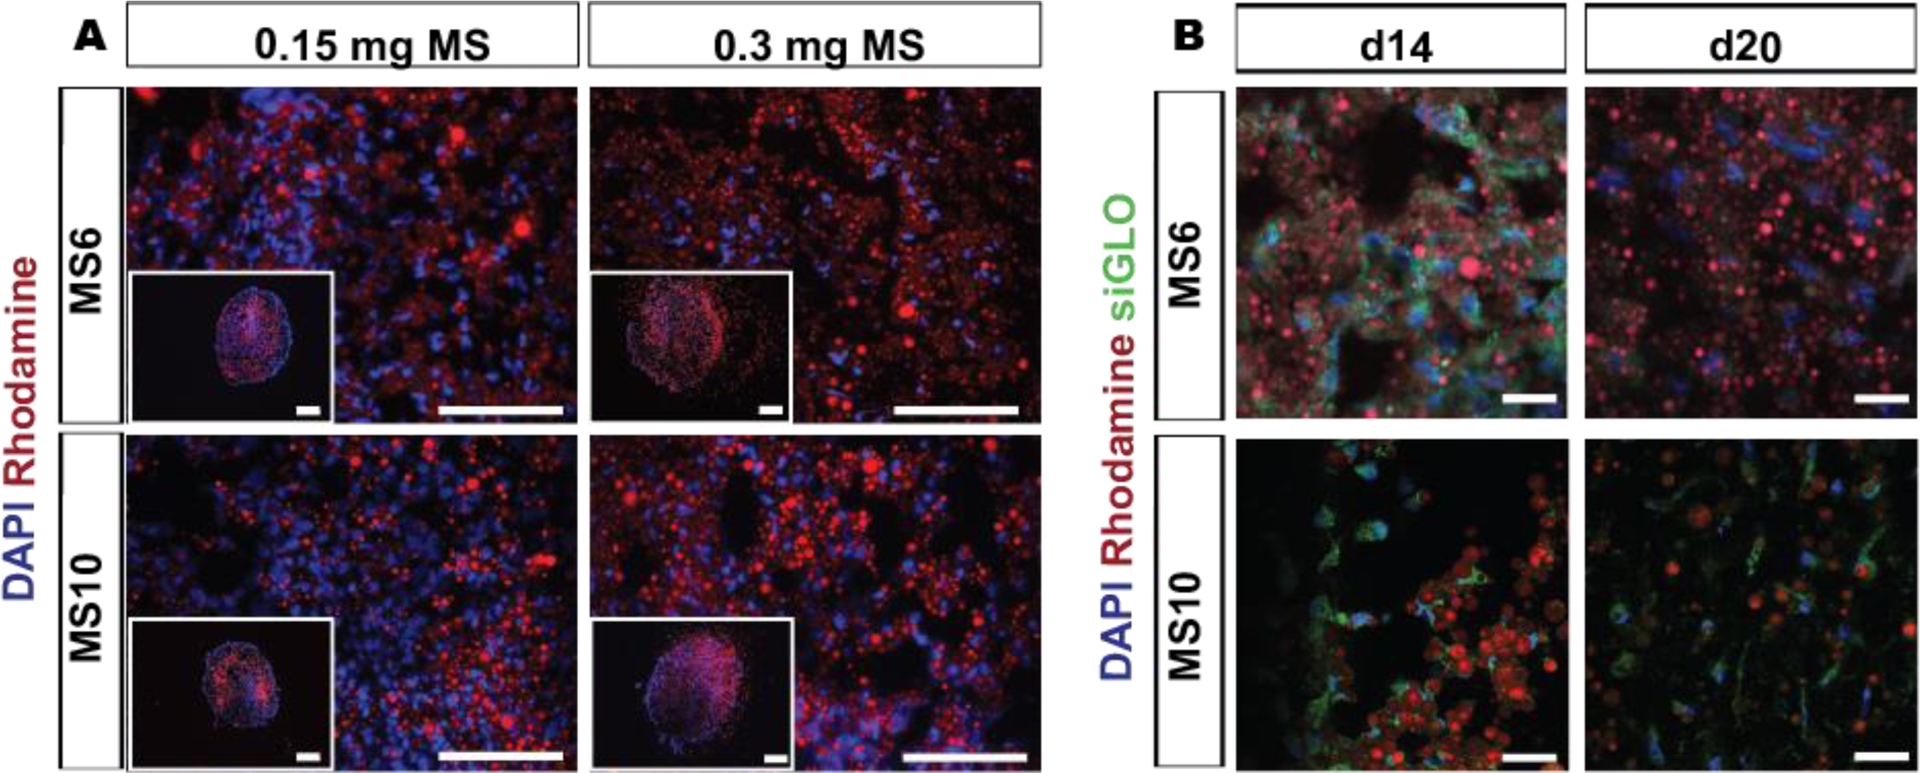
Distribution of incorporated MS in hMSC aggregates for sustained siRNA presentation. A) Fluorescence photomicrographs of rhodamine-labeled MS (red) incorporated into hMSC aggregates (0.15 and 0.30 mg MS per aggregate) and DAPI-stained cell nuclei (blue) after 3 days in vitro culture. Scale bars indicate 200 μm. B) Fluorescence confocal photomicrographs of rhodamine-labeled (red) siGLO-MS incorporated into hMSC aggregates to visualize siGLO uptake (green) and DAPI-stained hMSC nuclei (blue) in 3D aggregates after different culture periods. Scale bars indicate 30 μm.