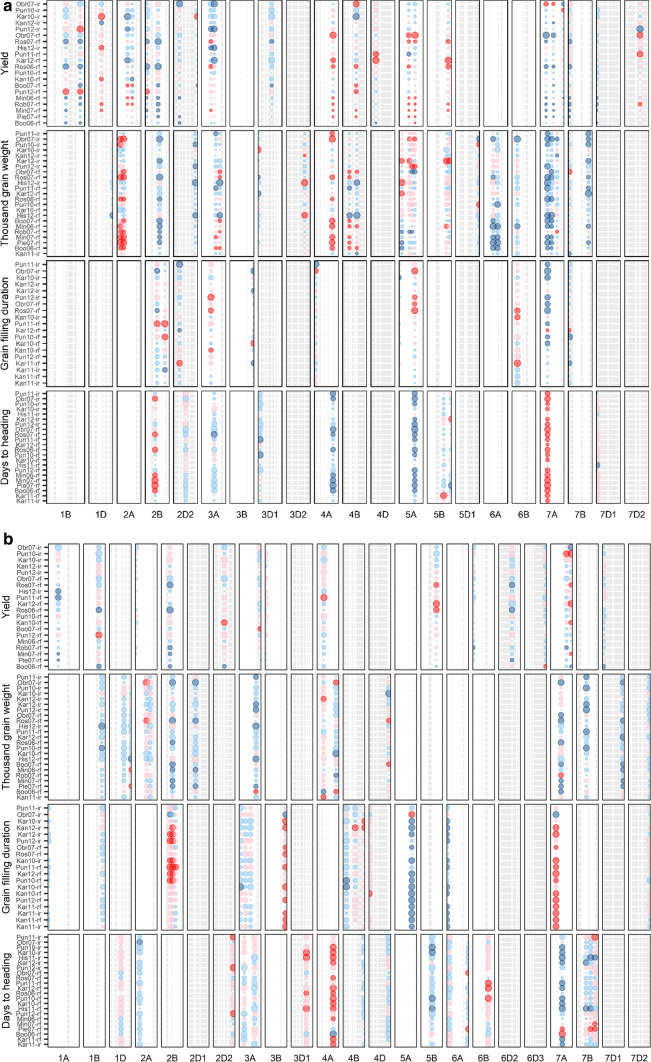
Fig. 2.
QTL for grain yield, thousand grain weight, grain filling duration and days to heading in the Excalibur/Kukri DH population with significant a Q * E effect or b main effect in multiple environments. Blue colour indicates that Excalibur allele increases the trait value at a QTL, pink indicates Kukri allele increases the trait value. The area of the circle is proportional to the magnitude of the estimated QTL effect on the trait, with the effects significantly different from zero indicated by stronger shade of either blue or pink. The trials on the y-axis are sorted according to the mean yield per trial. The highest mean yield per trial was recorded in Pun11-ir followed by Obr07-ir; however, the genetic variance for yield for yield in Pun11-ir was very low, and therefore this trial was excluded from the genome-wide QTL analyses of yield. The same was true for His11-ir, His11-rf, His12-rf, Kan10-ir, Kan12_rf, Kar10_rf, Kar12_ir and these trials do not appear on the y-axis of the panel for yield. Additionally, yield was not phenotyped in trials Kan11-ir, Kan11-rf, Kar11-ir and Kar11-rf; whenever present for other traits, these four trials are shown first on the y-axis. Some chromosomes are represented by multiple linkage groups (due to gaps in coverage), and their names reflect their relative position (e.g. 3D1 and 3D2) on wheat pseudomolecule (colour figure online)

