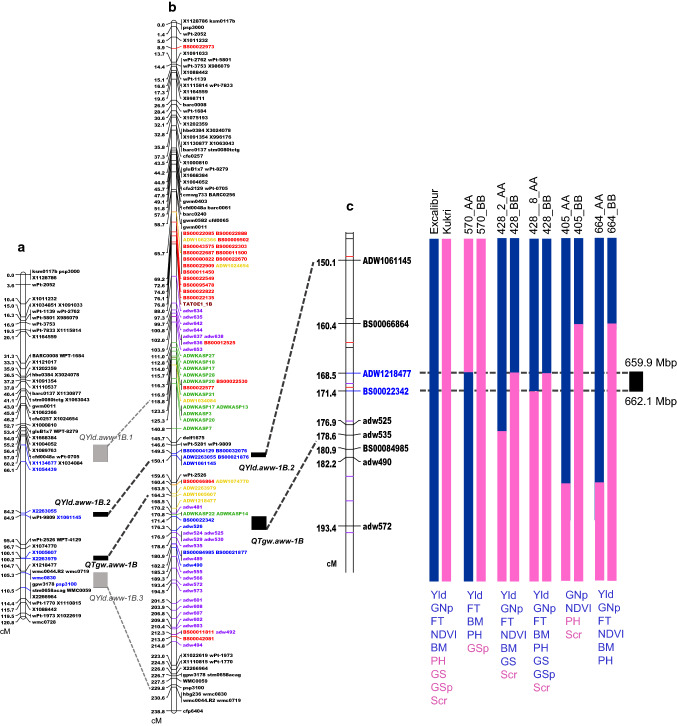
Fig. 3.
Fine mapping of QYld.aww-1B.2 in wheat. a Low-resolution genetic map of chromosome 1B in Excalibur/Kukri DH population with QTL position from Table 2 (blue markers show markers flanking QTL peak). b High-resolution DH genetic map of chromosome 1B showing SSR-DArT and GBS markers (black), BS markers (red), GBS converted to KASP markers (yellow), KASP markers from 90 K Wheat Illumina Infinium iSelect (Comai et al. 2004) and new KASP markers (purple). c Genotype of five NIL pairs (blue: Excalibur allele; pink: Kukri allele) aligned to Excalibur/Kukri DH genetic map and showing the QTL interval on Chinese Spring RefSeq v.1.0 reference sequence (black box). Traits that are significantly different (also reported in Fig. 4) within a NIL pair are shown in blue when the positive allele comes from Excalibur and pink when it comes from Kukri. Yld yield, GNp grains number per plot, FT fertile tillers, BM biomass, NDVI normalized difference vegetative index, GS grains/spike, GSp grains/spikelet, SpS spikelet/spike, PH plant height, Scr screenings (colour figure online)

