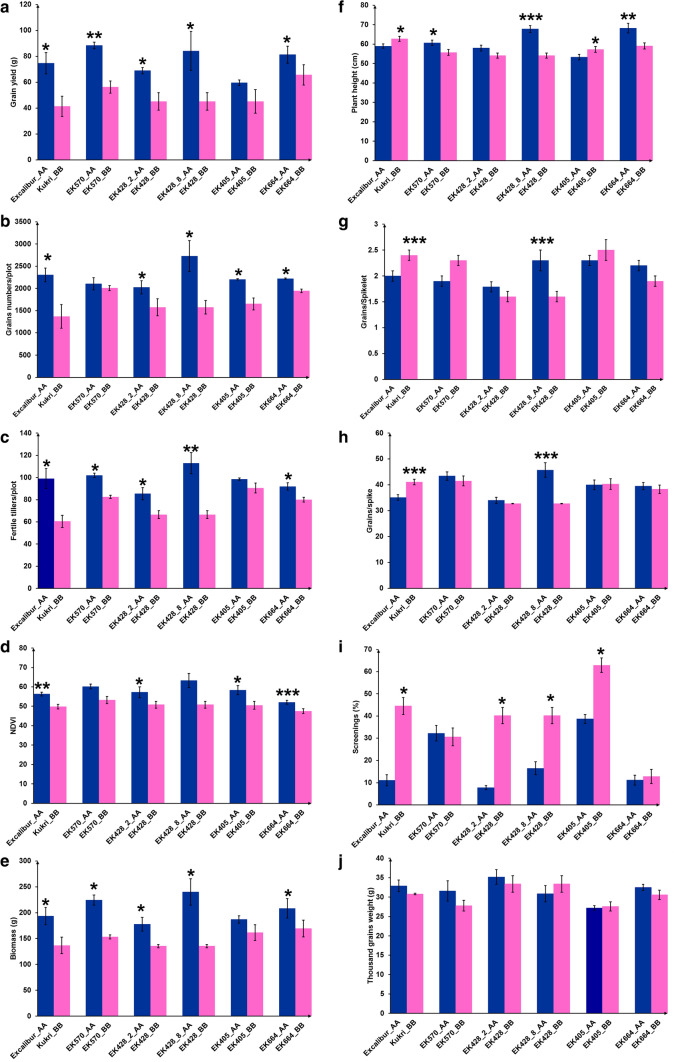
Fig. 4.
Phenotyping of five pairs of NIL segregating for QYld.aww-1B.2 and grown under severe drought and hot conditions (Urrbrae, SA, 2016). Grain yield (a), total grains number/plot (b), fertile tillers (c), NDVI (d), biomass (e), plant height (f), grains/spikelet (g), grains/spike (h), screenings (i) and TGW (j). Differences between the mean of each NIL within a pair was evaluated at specific marker in the QTL region using t test. *, **, *** means significant difference at p < 0.05, 0.01 and 0.001 level, respectively

