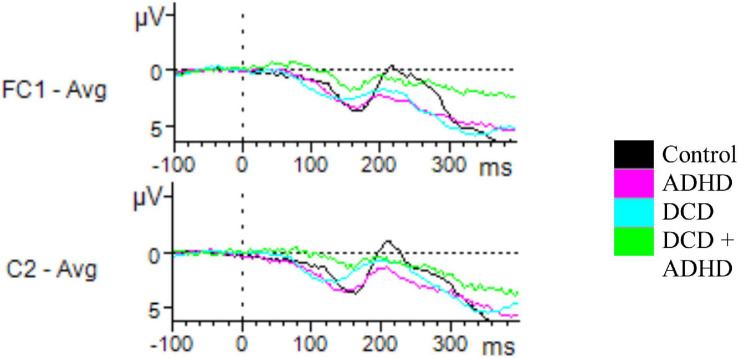
FIGURE 3.
Unsuccessful stop ERPs. Depicted are all electrodes with significant differences in amplitudes for N200 and P300 for incorrect stop trials. Time windows were set at 200–310 ms for N200, and 230–400 ms for P300. For N200, a significant effect of group on amplitude was found for C2, driven by a difference between the ADHD and control groups. For P300, a significant difference was found for FC1, driven by the DCD + ADHD and control groups.

