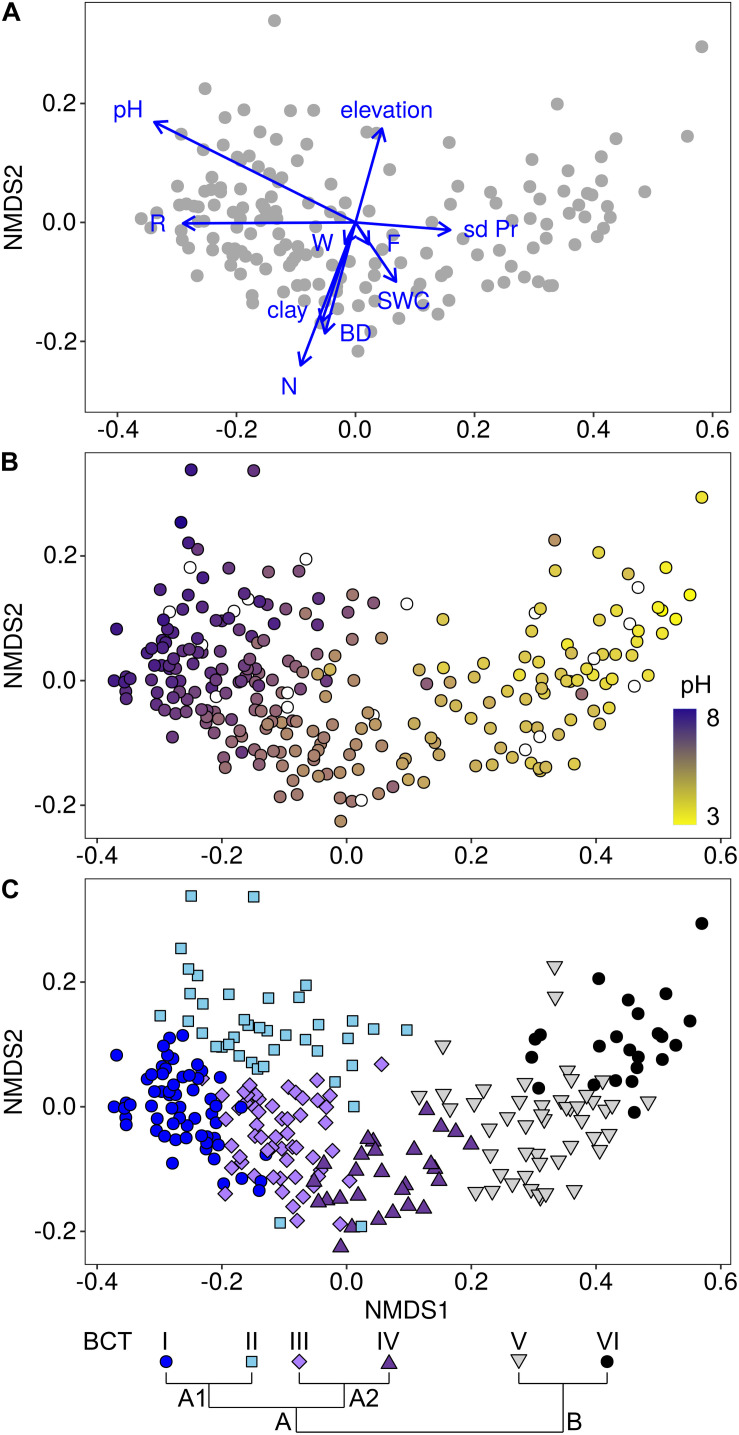
FIGURE 2.
Associations of bacterial communities with environmental factors (A), specifically with soil pH (B) and with bacterial community types (BCTs; C). The non-metric multidimensional scaling (NMDS) plots were based on Bray-Curtis dissimilarities among 160 sites, for which all environmental factors were available (A) and among all 255 sites (B,C). Environmental factors, i.e., pH, elevation, clay content, inter-annual variation in monthly precipitation (sd Pr), soil water content (SWC), soil bulk density (BD) and the plant indicators for soil nutrients (N), soil pH (R), soil moisture (F) and variability of soil moisture (W), which were selected in the linear model (Table 2), were fitted onto the NMDS (A). Length of vectors represent the strength of correlations and they point toward the largest correlation. The color gradient displays the pH gradient (B) from high pH in dark purple (maximum pH = 7.8) to low pH in yellow (minimum pH = 2.9). Sites with missing pH data are displayed in white. Associations of BCTs and sites are displayed with colored symbols (C). Pairs of adjacently clustering BCTs included BCT I (dark blue circles; n = 60 sites) and BCT II (light blue diamonds; n = 40 sites), BCT III (light purple squares; n = 56 sites) and BCT IV (dark purple upward pointing triangles; n = 28 sites) and BCT V (gray downward pointing triangles; n = 48 sites) and BCT VI (black circles; n = 23 sites). Clustering of BCTs is shown schematically (C) and in detail in Supplementary Figure 2.

