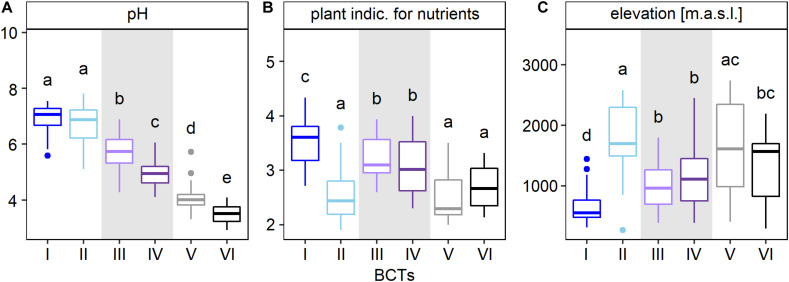
FIGURE 3.
Characterization of bacterial community types (BCTs) based on the environmental factors pH (A), plant indicator for nutrients (B), and elevation (C). The boxplots show median (middle horizontal bar), 75th and 25th percentile (upper and lower limit of the box), values up to 1.5 times the interquartile range above and below the box (whiskers) and values larger than 1.5 times the interquartile range (dots). Number of sites that were available for each factor were 236 for pH and 255 for the plant indicator for nutrients and elevation. BCT I to VI were defined using hierarchical clustering based on Bray-Curtis dissimilarities of mean OTU abundances for each site and the Ward’s minimum variance method (Ward D2). Pairs of adjacently clustering BCTs, i.e., BCT I (dark blue) and II (light blue), BCT III (light purple) and IV (dark purple), and BCT V (gray) and VI (black) were highlighted with a white or gray background. Factors were ordered according decreasing effect size (F-statistic) and the three factors with the largest differences among BCTs, omitting the plant indicator for pH because of its similarity with soil pH, are shown (ANOVA, Supplementary Table 7). Lower case letters represent significant differences (Tukey test, p-value < 0.05). Plots for the remaining 20 factors are shown in Supplementary Figure 4.

