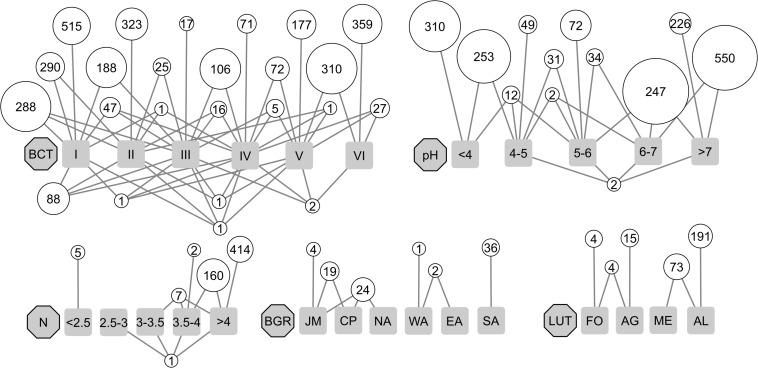
FIGURE 5.
Associations of OTUs to bacterial community types (BCT I to VI; in total 2,931 OTUs) and different environmental factors such as soil pH (pH; in total 1,788 OTUs) and the plant indicator value for soil nutrients (N; in total 589 OTUs) as well as biogeographic region (BGR; in total 86 OTUs), including Jura Mountains (JM), Central Plateau (CP), Northern Alps (NA), Eastern Central Alps (EA), Western Central Alps (WA), and Southern Alps (SA) and land-use type (LUT; in total 287 OTUs), including forest (FO), alpine grassland (AG), meadow (ME), and arable land (AR). Factors are represented by gray octagons and their different levels by gray squares. Levels of pH and N include open intervals at the left end and closed intervals at the right end. OTUs associated to the same level or levels are represented by white circles. Numbers in the circles represent the number of included OTUs while their diameters represent the total relative abundance of associated OTUs. The white circles of each factor are arranged in “rows” with the upper most “row” including OTUs associated to a single level. The lower “rows” included OTUs associated to an increasing number of factor levels. Additional factors that revealed OTU-associations are shown in Supplementary Figure 6.

