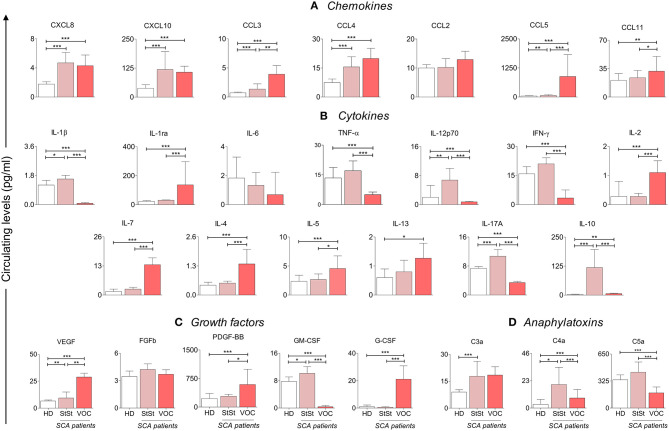
Figure 1.
SCA patients in VOC ( ) condition show an anti-inflammatory cytokine profile, when compared to StSt (
 ) and HD (
 ) groups. Statistically significant values were considered when p < 0.05, and are presented as *p < 0.05; **p < 0.01; ***p < 0.001. Chemokines (A), cytokines (B) and growth factors (C) were measured using Luminex, and anaphylatoxins (D) measured using CBA. Data is presented as median values and interquartile range in pg/ml. Statistical analysis was performed using Kruskal-Wallis and Dunn's Multiple Comparison Test. HD, healthy donors; StSt, Steady-state; VOC, vaso-occlusive crisis.

