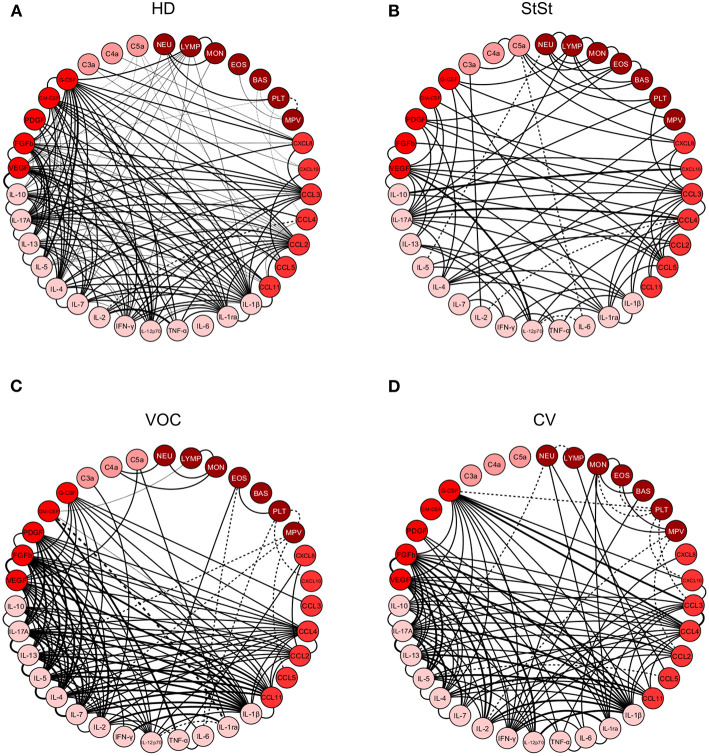
Figure 5.
Correlation analysis presented as a network of immunological cytokines, chemokines, growth factors, anaphylatoxins, and leukocytes in healthy donors (A), steady-state (B) vaso-occlusive crisis (C), and convalescence (D) stages. Each parameter is shown in a node. Statistical analysis was performed using the Spearman correlation test and the significant correlations (p < 0.05) are represented by a line connecting both nodes. The correlation was classified as weak (r < 0), moderate (0.36 < r < 0.68) and strong (r > 0.68), based on absolute value of correlation index r, represented by line thickness. Positive correlation is expressed by a continuous line, while negative correlation by dashed lines. NEU, Neutrophil; LYMP, Lymphocytes; MON, Monocytes; EOS, Eosinophils; BAS, Basophils; PLT, Platelets; MPV, Mean platelet volume; chemokines (CXCL8; CXCL10; CCL3; CCL4; CCL2; CCL5; CCL11), cytokines (IL-1β; IL-1ra; IL-6; TNF-α; IL-12p70; IFN-γ; IL-2; IL-7; IL-4; IL-5; IL-13; IL-17A; IL-10), growth factors (VEGF; FGFb; PDGF; GM-CSF; G-CSF) and anaphylatoxins (C3a; C4a; C5a). HD, Healthy donors; StSt, Steady-state; VOC, vaso-occlusive crisis; CV, convalescence.

