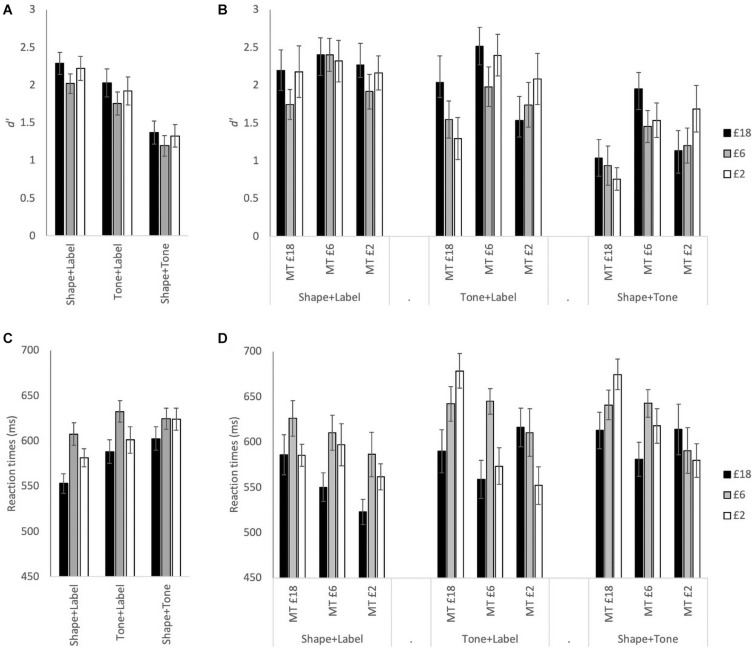
FIGURE 2.
(A) Mean d’ for £18, £6, and £2 reward associations for each stimulus type: Shape + Label, Tone + Label, and Shape + Tone, across all participants. (B) Mean d’ with the association and stimulus type conditions split across the three tone groups: MT £18 = medium tone with £18 association, MT £6 = medium tone with £6 association; MT £2 = medium tone with £2 association. (C) Mean RT across all participants. (D) Mean RT split across the three tone groups. Error bars represent ± 1 SEM.

