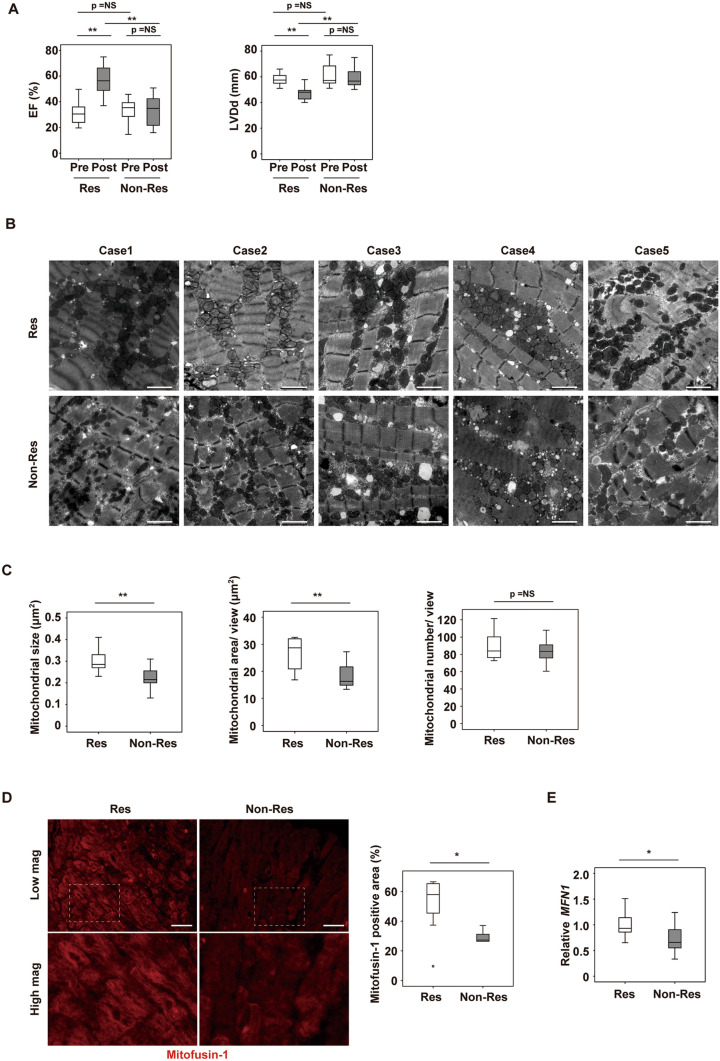
Figure 1.
Cardiac Mfn1 expression is suppressed in non-responders together with reduction in the size and number of mitochondria in cardiomyocytes. (A) UCG data of responders (Res) and non-responders (Non-Res) at baseline cardiac biopsy (pre) and 7–15 months later (post). LVEF and LV diastolic dimension (LVDd) (n = 14, 14, 8, and 8). (B, C) Transmission EM of cardiac tissue from Res and Non-Res (B), and quantification of the size, area and number of mitochondria per field (n = 10, 8) (C). Scale bar = 2.0 μm. Case 1–5 in Fig. 1B indicates panels are from different individuals. (D) Immunofluorescence for Mfn1 in cardiac tissue from Res and Non-Res. Right panel shows quantification of Mfn1-positive area (n = 12, 5). Scale bar = 50 μm. For this study, an outlier (n = 1 in Res group) and an abnormal value (n = 1 in Non-Res group) were excluded by boxplot (SPSS) for further statistical analysis. (E) Quantitative PCR of cardiac MFN1 expression in Res and Non-Res (n = 13, 8). For this study, an abnormal value (n = 1 in Res) was excluded by boxplot (SPSS) for further statistical analysis. Data were analyzed by two-tailed Student’s t-test. *P < 0.05, **P < 0.01. Results are shown as mean ± SEM. NS not significant. Small circle indicates outlier, triangle indicates abnormal value.

