Figure 2.
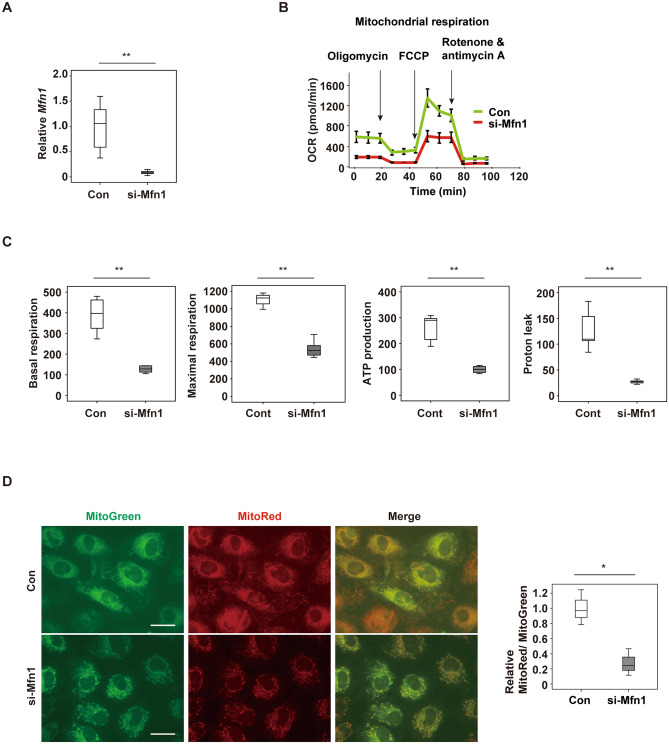
Suppression of Mfn1 promotes the decline of cardiomyocytes metabolism (A) Quantitative PCR of Mfn1 expression in NRVMs after introduction of control si-RNA (Con) or si-Mfn1 (n = 6, 6). (B,C) Evaluation of mitochondrial respiration with the Seahorse extracellular flux analyzer (B), basal respiration (n = 5, 5), maximal respiration (n = 4, 5), ATP production (n = 5, 5), and Proton leak (n = 5, 5). (C) In NRVMs after introduction of control si-RNA (Con) or si-Mfn1. For maximal respiration study, an abnormal value (n = 1 in si-Mfn1 group) was excluded by boxplot (SPSS) for further statistical analysis. (D) Staining of functional mitochondria (MitoRed) and total mitochondria (Mito Tracker Green FM (MitoGreen)) in NRVMs after introduction of control si-RNA (Con) or si-Mfn1. Scale bar = 5 μm. The right panel shows quantification of the MitoRed-positive area (n = 3, 3). Data were analyzed by two-tailed Student’s t-test. *P < 0.05, **P < 0.01. Results are shown as mean ± SEM. NS not significant. Small circle indicates outlier, triangle indicates abnormal value.

