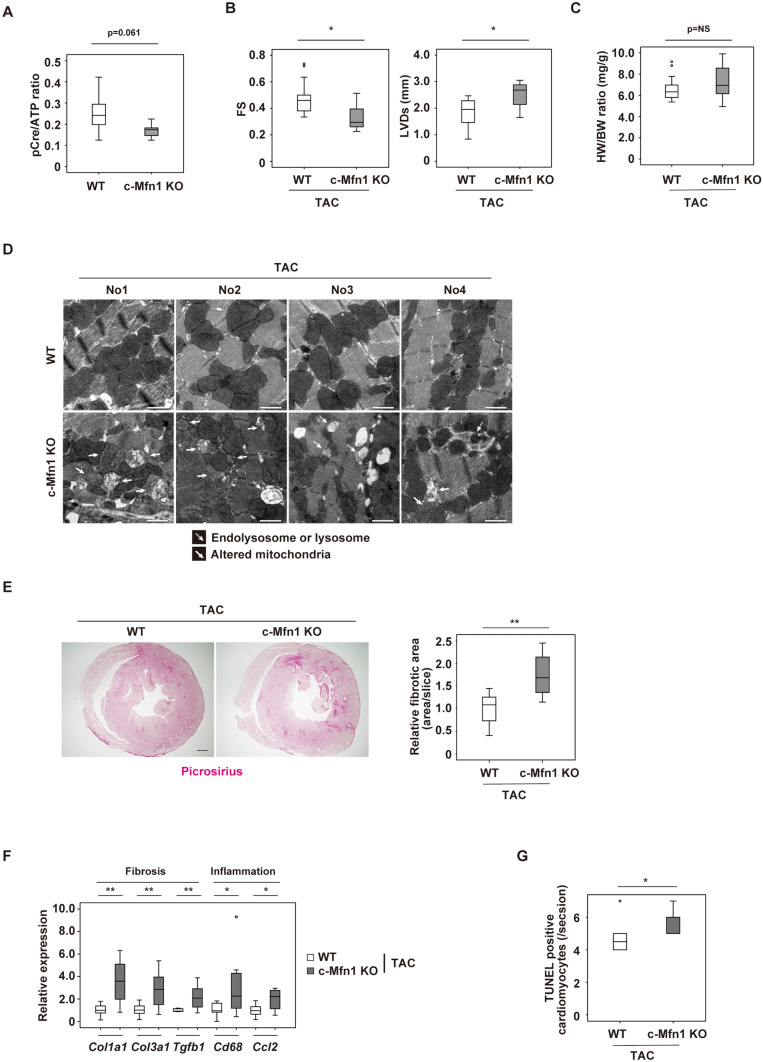
Figure 3.
Cardiac Mfn1 KO mice show reduced cardiac function. (A) Metabolomic study showing pCre/ATP ratio in cardiac tissues of wild type (WT) or MHC-Cre+/−; Mitofusin-1fl/fl (c-Mfn1 KO) mice (n = 7, 8). An abnormal value (n = 1 in the c-Mfn1 KO group) was excluded by boxplot (SPSS) for further statistical analysis. (B) echocardiography data of WT and c-Mfn1 KO mice two weeks after TAC. Fractional shortening (FS) (n = 18, 10) and LV systolic dimension (LVDs) (n = 18, 10) were analyzed. (C) Heart weight/body weight (HW/BW) ratio of indicated groups (n = 18, 10). (D) Transmission EM of cardiac tissues from WT and c-Mfn1 KO mice two weeks after TAC. No 1–4 indicates panels from different mice. Scale bar = 1 μm (E) Picrosirius staining of indicated mice. Right panel indicates relative fibrotic area (area/slice) (n = 5, 6). An abnormal value (n = 1 in c-Mfn1 KO) was excluded by boxplot (SPSS) for further statistical analysis. Scale bar = 500 μm. (F) Quantitative PCR of Col1a1 (n = 10, 11), Col3a1 (n = 10, 11), Tgfb1 (n = 8, 11), Cd68 (n = 8, 10) and Ccl2 (n = 10, 11) in cardiac tissues of indicated mice. An outlier (n = 1 in c-Mfn1 KO (Cd68)) and an abnormal value (n = 1 in WT (Tgfb1)) were excluded by boxplot (SPSS) for further statistical analysis. In WT (Tgfb1), n = 1, WT (Cd68), n = 2, were not detected, and also excluded from the analyses. (G) TUNEL positive cardiomyocytes in the indicated group (n = 5, 7). An outlier (n = 1 in WT) was excluded by boxplot (SPSS) for further statistical analysis. Data were analyzed by two-tailed Student’s t-test. *P < 0.05, **P < 0.01. Results are shown as mean ± SEM. NS = not significant. Small circle indicates outlier, triangle indicates abnormal value.

