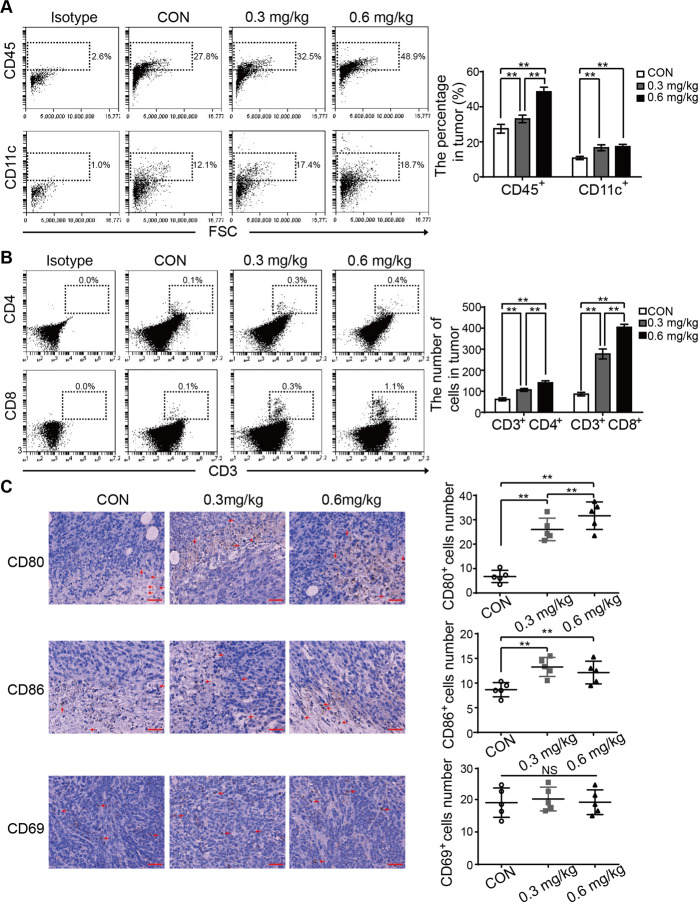
Fig. 5. Oleandrin activates anti-tumor immune response in mice.
Tumor primary cells were collected from the tumor-bearing mice and detected by flow cytometry. A TIL and tumor infiltrating DCs were analyzed by staining with CD45 and CD11c. The results were represented as percentage in tumors. B Tumor infiltrating T cells were analyzed by staining with CD3, CD4, and CD8. The absolute numbers of CD4+ and CD8+ T cells in tumors were expressed as mean ± SD. C Mouse tumor samples were stained using IHC for CD80, CD86, and CD69 expressions. Cell numbers were counted under a 40× objective. Each dot denotes the immune cell number from a tumor section. Mean and standard deviation of immune cell number in each group are shown. Scale bar = 40 μm. n = 5, **p < 0.01 vs. control. CON, control.

