Figure 2.
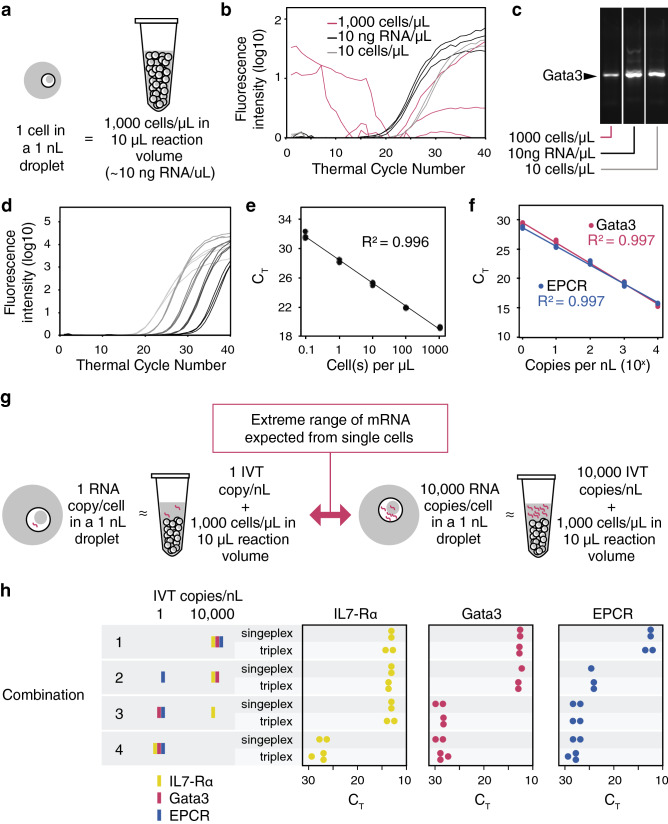
High cell lysate concentrations were shown to be inhibitory to RT-qPCR, thus modifications to current RT-qPCR conditions were required. (a) The lysate concentration of a single cell encapsulated in a 1 nL droplet is equivalent to approximately 1000 cells/μL on the scale of conventional RT-qPCR volumes. (b,c) To demonstrate the inhibitory effect, one-step RT-qPCR was performed to detect Gata3 expression in EL4 cells at 10 and 1000 cells/µL concentration in a 10 µL reaction volume, as well as the amount of total RNA equivalent to 1000 cells/μL (10 ng RNA/μL). Inhibition was observed as either a CT delay or sporadic fluorescence generation with no exponential phase at 1000 cells/µL (b). Gel electrophoresis also showed reduced amplification products at higher cell concentration (c). See Supplementary Figure S2 for full-length gel image. (d) Gata3 mRNA was quantified efficiently on a range of 1 to 104 EL4 cell(s) (shown by darkest to lightest colour plots) in a 10 µL RT-qPCR using our in-house one-step RT-PCR mix with gp2.5. (e) Dilutions of cells or (f) Gata3 and EPCR IVT doped in constant cell lysate concentrations (1000 cells/µL) were analyzed by RT-qPCR and plotted against their CT values to demonstrate high amplification efficiencies using our in-house one-step RT-PCR mix. (g) To emulate the range of mRNA expected from single cells, IL-7Rα, Gata3, and EPCR IVT were doped in constant cell lysate concentrations (1,000 cells/µL) at either 1 or 10,000 copies/nL. (h) Using our in-house, multiplex, one-step RT-PCR mix, the three target genes were simultaneously quantified in four different combinations of transcript levels. The difference in CT values obtained using our single and triplex assays were found to be insignificant after 40 thermal cycles (P > 0.1). Each dot represents one technical replicate. Data was analyzed and plotted using JMP (version 15.2.1 www.jmp.com)

