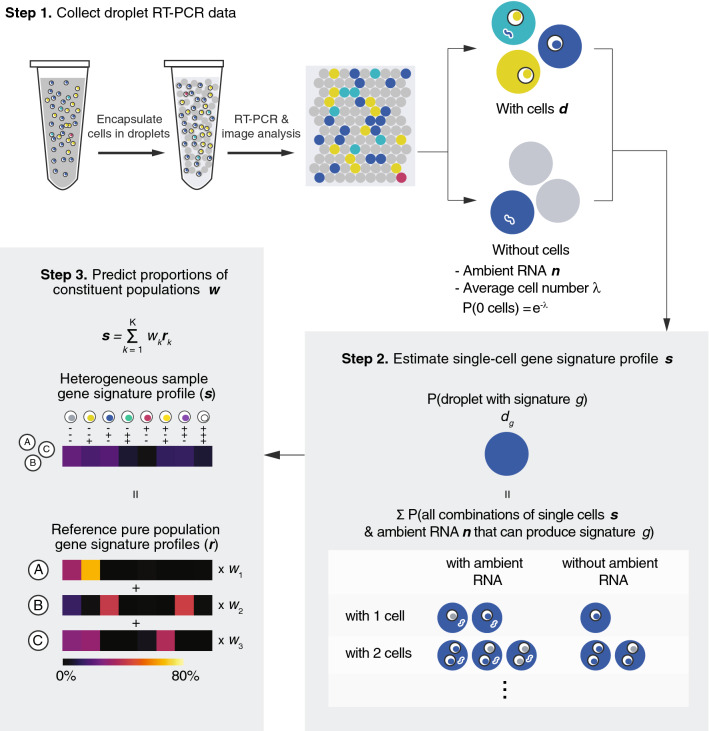
Figure 4.
Schematic of deconvolution model to predict single-cell gene signature profiles and the cellular composition of heterogeneous samples. Step 1: Cells are encapsulated and assayed using the droplet RT-PCR platform. The fluorescent signal in every droplet is quantified and the droplet is classified as positive or negative for the presence of cells as well as each target gene. The proportions of droplets that contain cells displaying each gene signature (d) are determined. Droplets without cells (empty droplets) inform the probability of observing a certain gene signature in a droplet caused by ambient RNA (n). The average number of cells each droplet contains (λ) is estimated based on Poisson statistics and the proportions of empty droplets. Step 2: Single-cell gene signature profile of the sample (s) is estimated by correcting for ambient RNA and cell doublet effects. Due to the presence of ambient RNA and droplets that contain more than 1 cells, the droplet profile d does not represent the single-cell gene signature profile of the sample. Considering all the combinations of ambient RNA and cells that can generate a certain signature (up to having 2 cells in each droplet), the proportion of cells expressing each gene signature (s) is computed based on the data collected in Step 1. Step 3: The proportions of constituent populations in the heterogeneous sample (w) is predicted using the sample (s) and reference (r) gene signature profiles. Given that the heterogeneous sample is a physical mixture of its constituent cell populations with reference gene signature profiles (r) (obtained by assaying pure populations), the composition of the sample mixture (w) can be predicted based on the non-negative least squares model using the mixed profile (s) obtained from Step 2 and the reference profiles (r).

