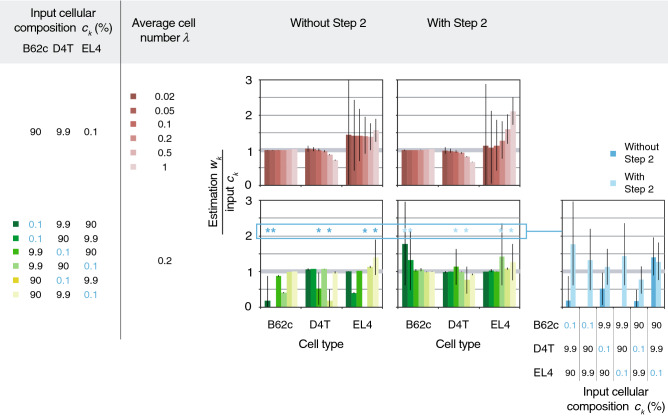
Figure 5.
Computer simulation of the droplet assay provides insight into the effects of different input parameters on the accuracy and precision of the assay. Representative results from the simulation illustrating the effects of varying the average cell number per droplet λ and the cellular composition c. Three cell lines (B62c, D4T, and EL4) were assayed using the droplet RT-PCR platform to acquire empirical, real-world single-cell gene signature profiles and ambient RNA levels, which were used as input reference profiles and ambient RNA levels (r and n) for the simulation. The bar graphs show predictions made with or without implementing Step 2 of the deconvolution model (means of n = 1000 trials, error bars represent the 95% confidence intervals). As expected, an increase in λ (red bar graphs) resulted in higher precision of our predictions, as evidenced by the reduced error bars. The accuracy was improved by incorporating Step 2, which corrected for ambient RNA and duplets, but only when λ ≤ 0.2. When varying cellular compositions (green bar graphs), an improvement in accuracy was also observed when Step 2 was applied, whereas the rarest populations (marked by asterisks and plotted separately in the blue bar graph for better comparison) were often undetected without this correction step.

