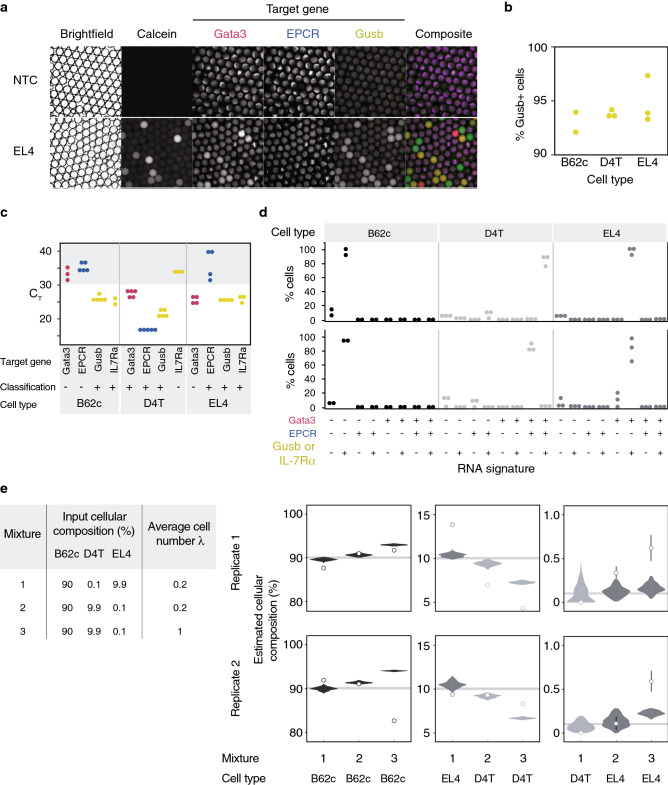
Figure 6.
Implementation of droplet RT-PCR for single-cell gene expression profiling and rare cell detection. (a) Images of droplets containing EL4 crude cells after amplification targeting Gata3 (red), EPCR (blue), and Gusb (green). A substantial increase in fluorescent signal indicating the expressions of Gata3 and Gusb was observed in the EL4 sample but not in the no template control (NTC). (b) Three cell lines (A: B62c, B: D4T, and C: EL4) were assayed using the droplet RT-PCR platform. Detection rates were determined based on the percentage of cells classified as Gusb (housekeeping gene) positive. Each dot represents one technical replicate. (c) Population-level gene expression profiles of the three cell lines determined by conventional RT-qPCR. Targets with CT value over 30 are classified as negative. Each dot represents one technical replicate. (d) Percentage of single cells expressing each gene signature determined by our droplet RT-PCR assay. Each dot represents one technical replicate. (e) Three cell lines were mixed at known ratios and assayed using the droplet RT-PCR platform. The parameters tested are shown in the left table. Results are grouped by the proportions of each cell line in the mixtures and the thick horizontal grey bars indicate the input proportions. The empirical predictions are plotted as dots with error bars representing standard errors, while the results obtained from our computer simulation (100 trials) are overlaid as violin plots.

