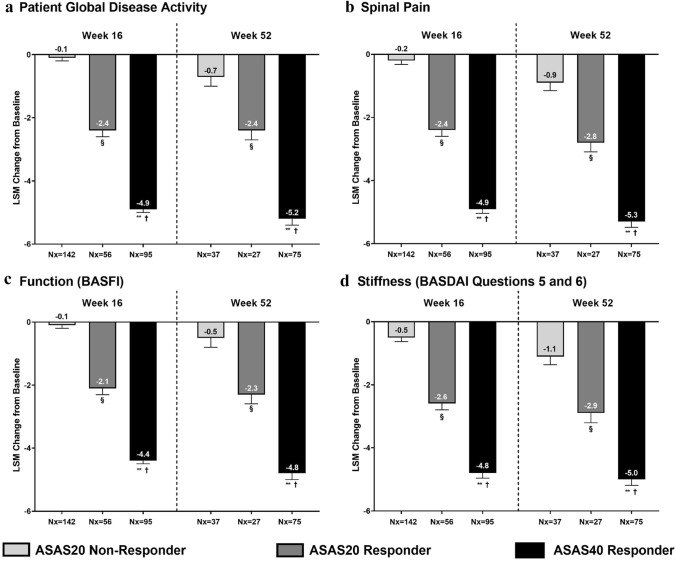
Fig. 3.
Association between ASAS response and changes from baseline in measures of patient global disease activity (a), spinal pain (b), function (c), and stiffness (d) (BASDAI questions 5 and 6) at weeks 16 and 52. Values are LSM (SE) from ANCOVA. Only observed data were used in this analysis. P values were from ANCOVA after correcting for baseline value, age, gender, and ASAS response category. §p < 0.001, ASAS20 responder vs. ASAS20 non-responder; **p < 0.001, ASAS40 responder vs. ASAS20 non-responder; †p < 0.001, ASAS40 responder vs. ASAS20 responder. ANCOVA analysis of covariance, ASAS Assessment of Spondyloarthritis International Society, BASDAI Bath Ankylosing Spondylitis Disease Activity Index, BASFI Bath Ankylosing Spondylitis Functional Index, LSM least squares mean, Nx number of non-missing observations, SE standard error

