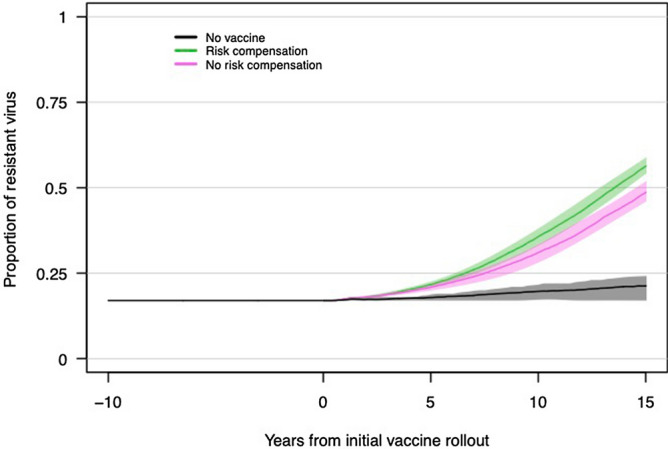
Figure 3.

Frequencies of HIV genotypes that are either sensitive or resistant to vaccine induced immune responses, following introduction of a partially effective vaccine (here shown as years from vaccine rollout). The plot shows the mean and 95% credible interval of 64 replicates for each scenario (no vaccine, vaccine with risk compensation, and vaccine without risk compensation). The vaccine scenarios include a vaccine with 60% vaccine efficacy, 83.3% vaccine sensitive virus at vaccine rollout, and 70% population vaccine coverage (50% overall vaccine efficacy at rollout). Risk compensation is modeled as a 30% reduction in condom use among vaccinated individuals.
