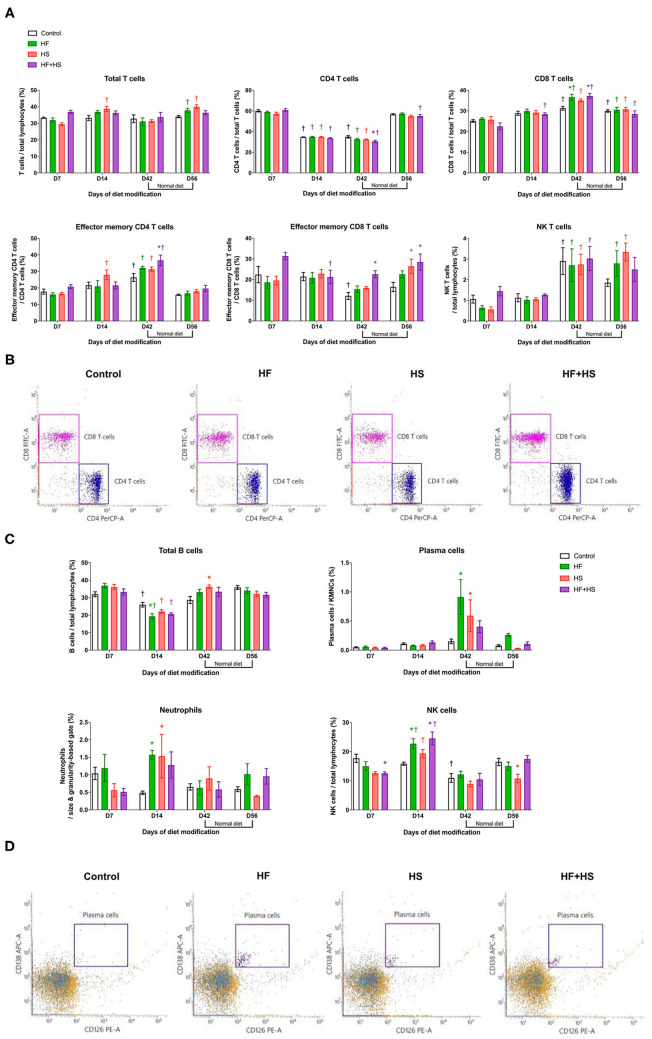
Figure 3.
Flow cytometry analyses of KMNCs isolated from kidneys of normal mice. (A) Changes in the intrarenal T cell subpopulation by dietary modification. HF and HF+HS diets increased the proportion of total CD8 T cells among total T cells on day 42 after dietary modification. HF+HS diet also increased the proportion of effector memory CD4 and CD8 T cells. (B) The representative dot plots analyzing T cells on day 42. Gated cells indicate CD4 T cells and CD8 T cells among total T cells. (C) HF diet and HS diet increased the infiltration of plasma cells and neutrophils on days 42 and 14 after dietary modification, respectively. HF diet and HF+HS diet increased the infiltration of activated mature B cells and NK cells on day 14 after dietary modification. (D) Representative dot plots analyzing plasma cells on day 42. Gated cells indicate plasma cells expressing CD138 and CD126 among total kidney mononuclear cells. *P < 0.05, compared with the control group at each time point. †P < 0.05, compared with day 7 in the same group (n = 5 for each group at each time point). Statistical analyses were performed with two-way ANOVA test followed by Tukey's test. HF, high-fat; HS, high-salt; HF+HS, high-fat with high-salt.

