Figure 3.
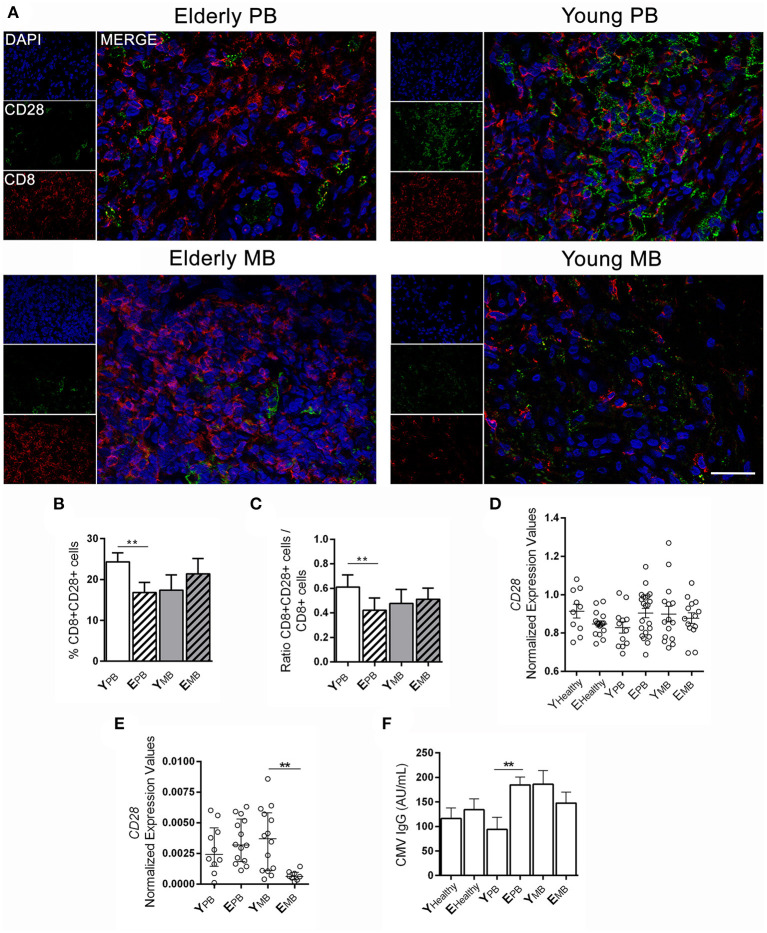
CD28 expression in blood and skin lesion samples. Fluorescence immunostaining of CD28 (green) and CD8 (red) in skin lesions. (A) The images are representative of a patient from each group of four individuals. Images were visualized and obtained by a Zeiss Colibri fluorescent microscope and the scale bar was 20 μm. The graphs show the frequency of (B) CD8+CD28+ T cells, (C) ratio between CD8+CD28+ cells and CD8+ T cells, and the data are demonstrated by means ± SD. The results of CD28 gene expression in (D) blood samples and (E) skin lesion samples are shown in normalized expression values. Whole blood samples were measured using Biomark's microfluidic-based qPCR technology and experiments with skin lesions were performed with RT-qPCR. Each circle represents an individual, horizontal bars indicate the mean. (F) IgG anti-CMV antibodies in sera samples in the studied groups were performed by a chemiluminescence method. Bars represent mean ± SD. Analysis was performed by one-way ANOVA followed by Tukey's multiple comparison test, and **P < 0.01.

