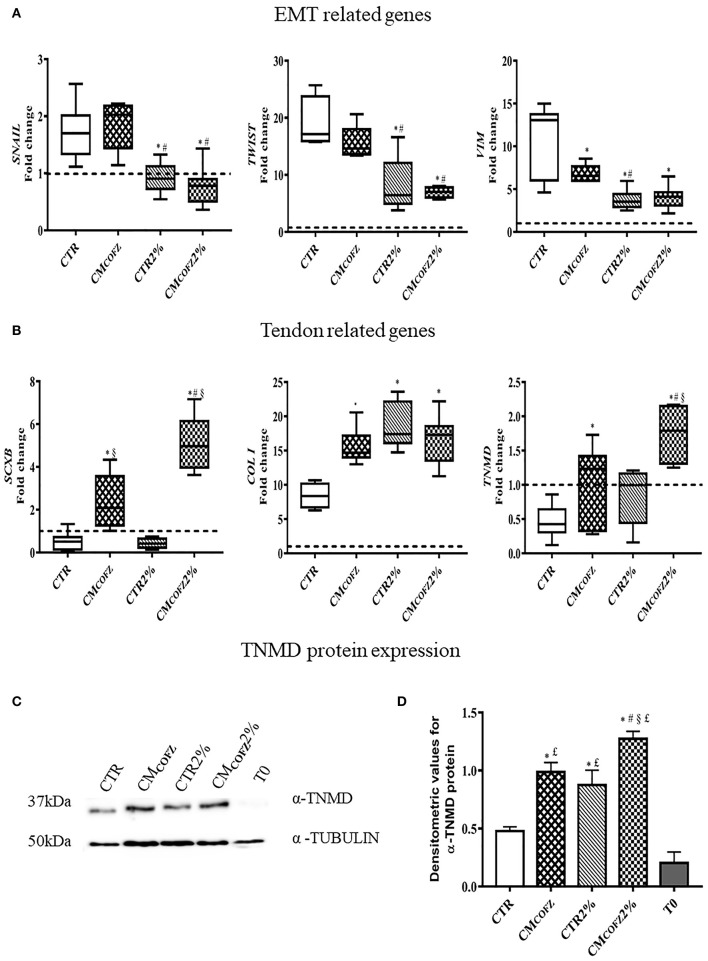
Figure 6.
Evaluation of tenogenic potential of CMCOFZ 2%. Real time qPCR analysis for (A) EMT genes and (B) tendon related genes on samples in AECs cells cultured for 14 days in different experimental conditions. Relative quantification of each mRNA gene expression normalized to endogenous GAPDH (internal control) was calculated using the ΔΔCt method and presented as fold change over the AECs T0 =1 (calibrator; dashed line). (C) Representative Western Blot image for α-TNMD and α-TUBULIN proteins expression. (D) α-TNMD protein quantification normalized on α-TUBULIN expression levels and expressed as means ± S.D of three replicates/each experimental condition. Values were considered significant for p < 0.05, with the indicated superscripts *vs. CTR, #vs. CMCOFZ, §vs. CTR 2%,£vs. T0.

