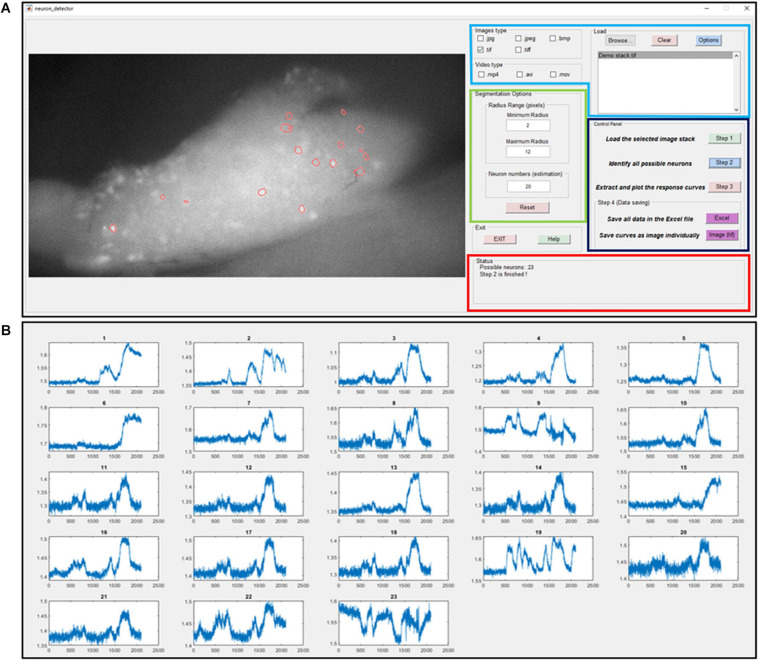
FIGURE 4.
The graphic-user-interface (GUI) of the custom-built software for automatic extraction of GCaMP6f responses from image stacks. (A) The GUI with five panels: The image process window (right), the input image format selection panel (right top with blue label), segmentation options (right middle with green label), control panel (right middle with black label) and status panel (right bottom with red label). (B) The extracted intensity profiles of evoked DRG neurons. Detailed descriptions are listed in Supplementary Material 3.

