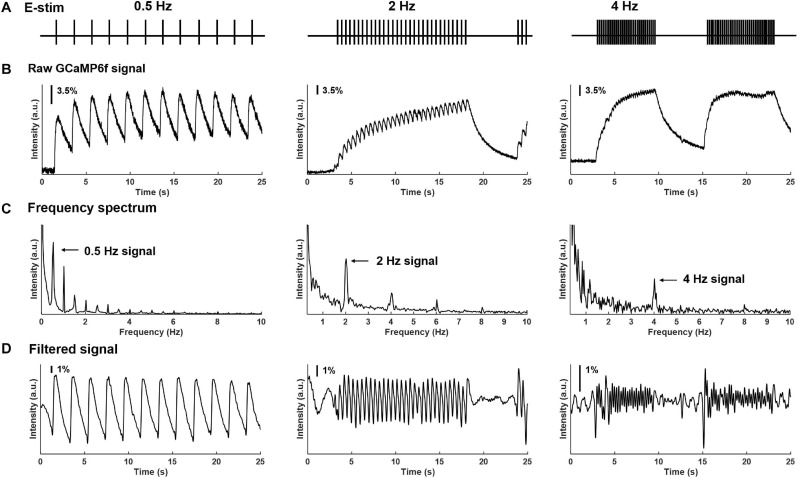
FIGURE 5.
Frequency spectrum analysis on GCaMP6f responses evoked by electrical stimulation of the attached dorsal root. (A) The implemented electrical stimulation at 0.5, 2, and 4 Hz, respectively. (B) Evoked GCaMP6f signals in individual DRG neurons. (C) The frequency domain of the GCaMP6f transients from fast Fourier transform. (D) Band-pass filtered GCaMP6f signals.

