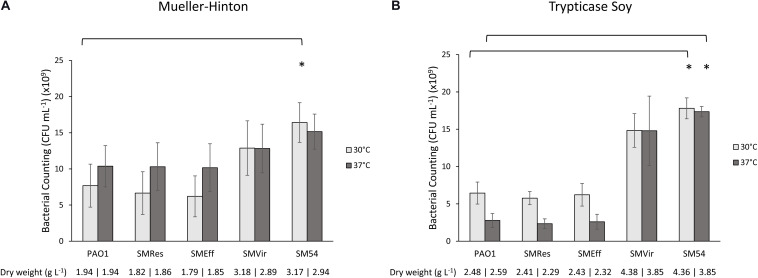
FIGURE 3.
Bacterial counting and dry weight at 24 h of growth. Bacterial cells were counted after 24 h of culture at 30°C (light gray) or at 37°C (dark gray) in (A) Mueller-Hinton Broth and (B) Trypticase Soy Broth. All cultures were agitated at 225 rpm to allow proper oxygenation. Results represent mean values of three independent experiments. Error bars represent standard deviation and asterisks (*) represent a significant difference in the number of CFU counted between the two strains compared according to a Student’s t test (p < 0.01). Below each graph, dry weights produced by these cultures are indicated.

