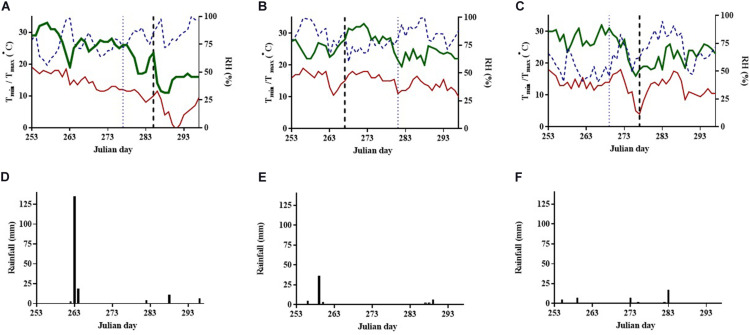
FIGURE 1.
Changes in (A–C) daily minimum (Tmin, solid thin line) and maximum air temperature (Tmax, solid thick line) (°C), relative humidity (RH%, dotted line) and (D–F) daily rainfall (mm, solid bars) during the ripening periods in years (A,D) 2011, (B,E) 2012, and (C,F) 2013 in a pomegranate cv. ‘Wonderful’ orchard. Vertical dotted lines on x axes depicted in a-c graphs, show the timings that fruit maturation (thin dotted lines) and cracking and russeting symptoms (thick dotted lines) firstly occurred in each year.

