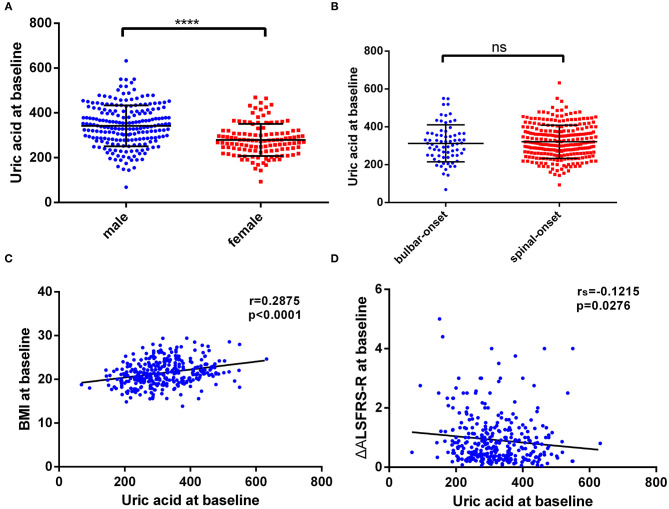
Figure 1.
The distribution of baseline serum uric acid and its correlation with BMI and disease progression rate. (A) The distribution of uric acid levels in male and female patients. (B) The distribution of uric acid levels in bulbar-onset and spinal-onset patients. (C) The correlation between uric acid levels and BMI. (D) The correlation between uric acid levels and ΔALSFRS-R. The distribution of uric acid was expressed as the mean with standard deviation. ****P < 0.0001.

