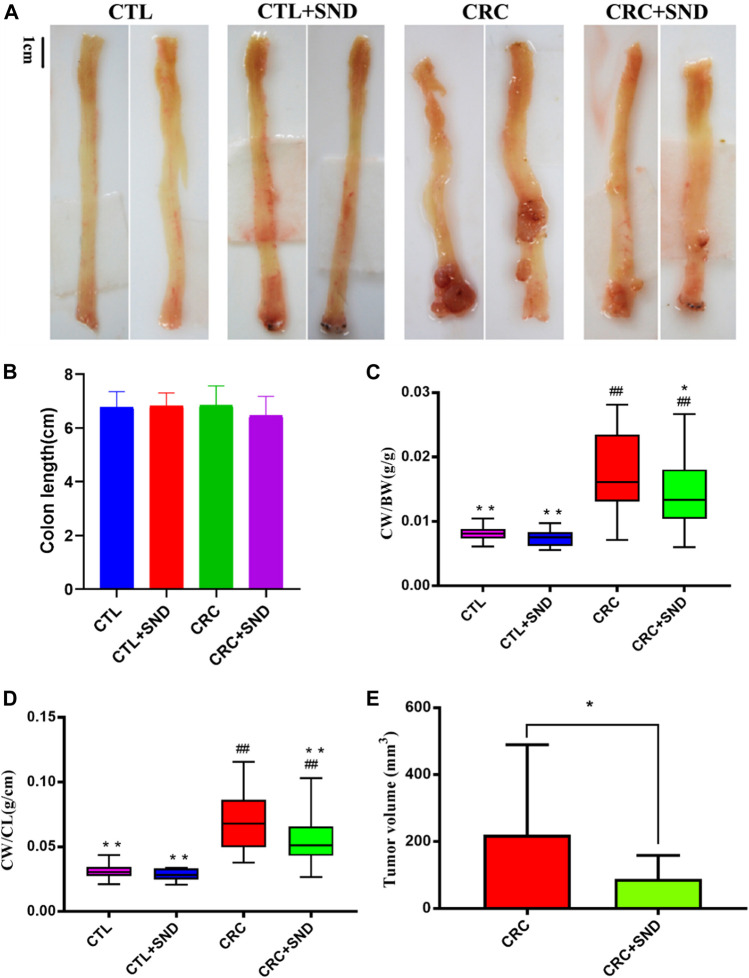
FIGURE 2.
The effect of SND on colonic phenotype. (A) Colonic phenotype of different groups, n = 5. (B) Colon length of different groups, n = 5. (C,D) Colon weight (CW)/Body weight (BW) and colon weight (CW)/Body weight (BW) are chosen to be indicators of colon weight, n = 5. (E) Tumor volume of different groups, n = 5. Compared to CRC group, *p < 0.05, **p < 0.01; compared to CTL group, ##p < 0.01.

