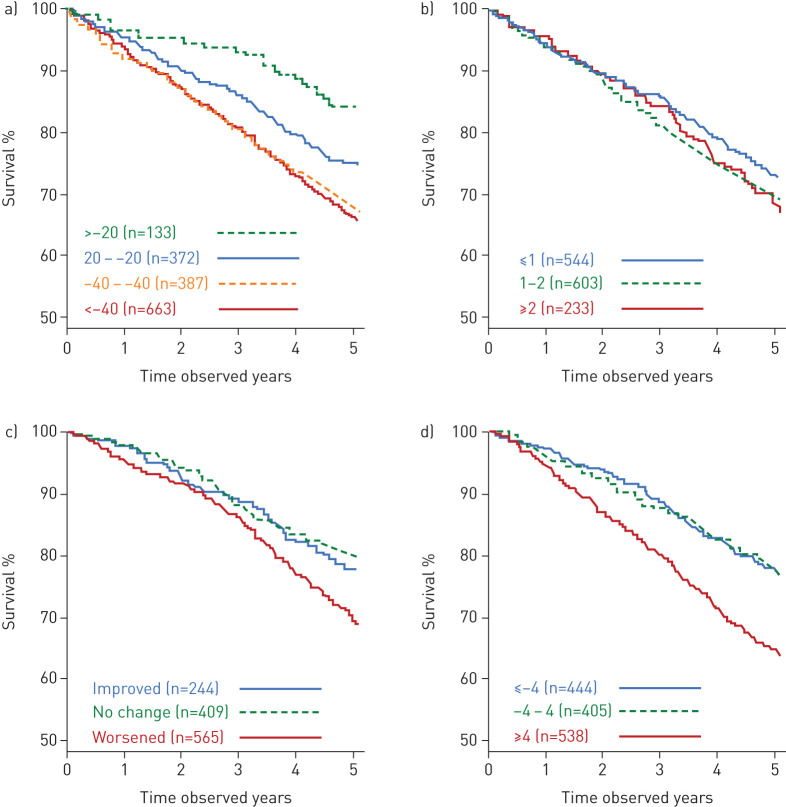
FIGURE 3.
Kaplan–Meier curves for mortality from year 3 to year 8 for a) forced expiratory volume in 1 s decline (mL·year−1); b) computed tomography decline (lowest 15th percentile density method) (g·L−1·year−1); c) body mass index, obstruction, dyspnoea, and exercise (BODE) index change; d) St George's Respiratory Questionnaire total score change.

