Figure 1.
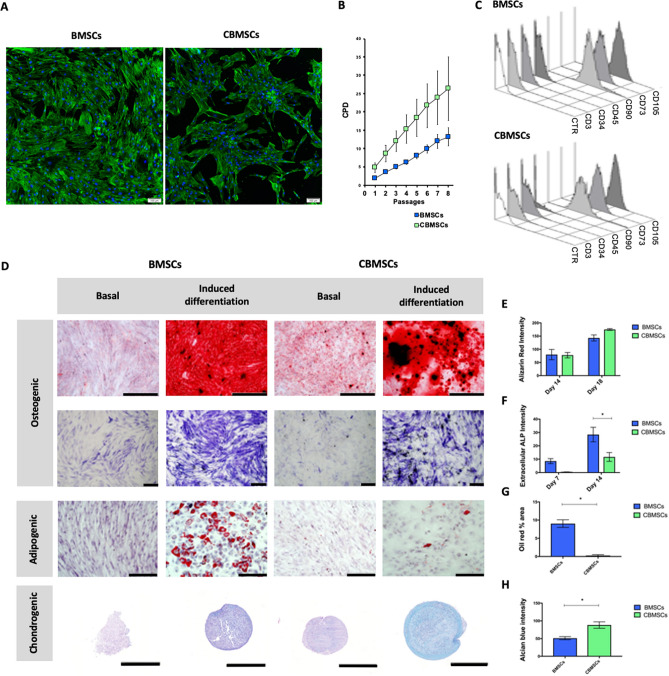
Characterization of BMSCs and CBMSCs. (A) Cell morphology as illustrated by DAPI nuclear, and phalloidin actin cytoskeleton fluorescent staining. Scale bars represent 200 μm. (B) Growth curve is represented as Mean ± standard deviation (SD) of cumulative population doublings (CPD) for passage 1–8. (C) Phenotypic characterization by flow cytometry of BMSCs and CBMSCs shows positive expression of stem cell surface markers CD105, CD90, CD73, and negative expression for CD45, CD34, and CD3. (D) Representative images of in vitro tri-lineage differentiation potential of BMSCs and CBMSCs towards osteogenic, adipogenic, and chondrogenic lineages confirmed by histochemical staining with Alizarin red and Alkaline phosphatase, Oil red O, and Alcian blue, with scale bars representing 500 μm, 200 μm, 200 μm, and 500 μm, respectively. (E) Quantitative measurement of solubilized bound Alizarin red stain of both BMSCs and CBMSCs induced with osteogenic supplements after 7 and 14 days. (F) Extracellular ALP staining quantification after 7 and 14 days of osteogenic priming. (G) Quantification of lipid droplet area in images of oil red staining following adipogenic induction of BMSCs and CBMSCs. (H) Quantification of Alcian blue colour intensity of sections through pellets of BMSCs and CBMSCs that underwent chondrogenic priming. Data is presented as Mean ± standard error of the mean (SEM). Statistical analysis was by unpaired Student’s t-test for single experimental condition (B, G, H) and by two-way ANOVA followed by Holm–Sidak’s multiple comparison test for multiple experimental conditions (E, F). *Significant difference between MSCs of different tissue origin.

