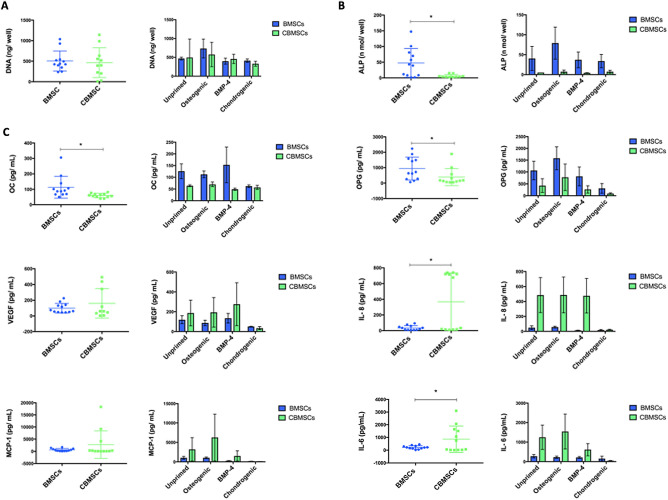
Figure 2.
Growth, differentiation and secretion profiles of BMSCs and CBMSCs after priming with either standard osteogenic differentiation supplements, BMP-4, or chondrogenic supplements. Scatter plots represent all MSC donor samples pooled regardless of priming, while bar charts present Mean ± SEM of each priming condition. *Significant difference between MSC origin. (A) Cell proliferation after 6 days of priming as assessed by Pico Green Assay for DNA content. (B) Intracellular ALP expression after 6 days of priming. (C) Multiplex array analysis of soluble secreted osteogenic cytokines; Osteoprotegerin (OPG), Osteocalcin (OC), and Osteopontin (OPN), immunogenic cytokines; Interleukin 6 and 8 (IL-6,8), Monocyte chemoattractant protein 1 (MCP-1), as well as angiogenic factors; Vascular Endothelial Growth Factor (VEGF). Statistical analysis was by unpaired Student’s t-test for single experimental condition (dot plots) and by two-way ANOVA followed by Holm–Sidak’s multiple comparison test for multiple experimental conditions (histograms). *Significant differences between MSCs of different tissue origin.

