Figure 3.
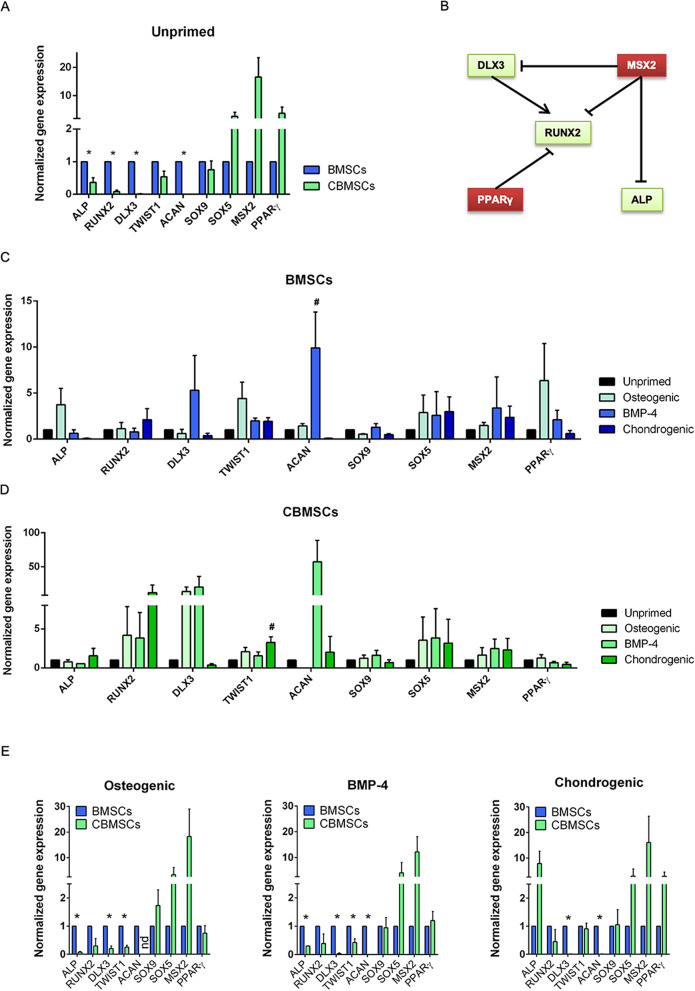
Gene expression profiles of unprimed and primed BMSCs and CBMSCs. (A) Histogram showing gene expression of BMSCs and CBMSCs at the steady state; values are represented as Mean ± SEM and normalized to BMSCs. (B) Schematic summarizing positive and negative regulations of the gene expression of crucial osteogenic and chondrogenic players. (C) Histogram representing transcriptional profile of BMSCs upon different differentiation primings protocols; values are represented as Mean ± SEM and normalized to unprimed BMSCs. (D) Histogram representing transcriptional profile of CBMSCs upon different differentiation primings protocols; values are represented as Mean ± SEM and normalized to unprimed CBMSCs. Statistical analysis was by unpaired Student’s t-test for single experimental condition (A, E) and by one-way ANOVA followed by Holm–Sidak’s multiple comparison test for multiple experimental conditions (C, D). *Significant difference between MSCs of different tissue origin (A, E); #significant difference between primed and unprimed MSCs (C, D).

