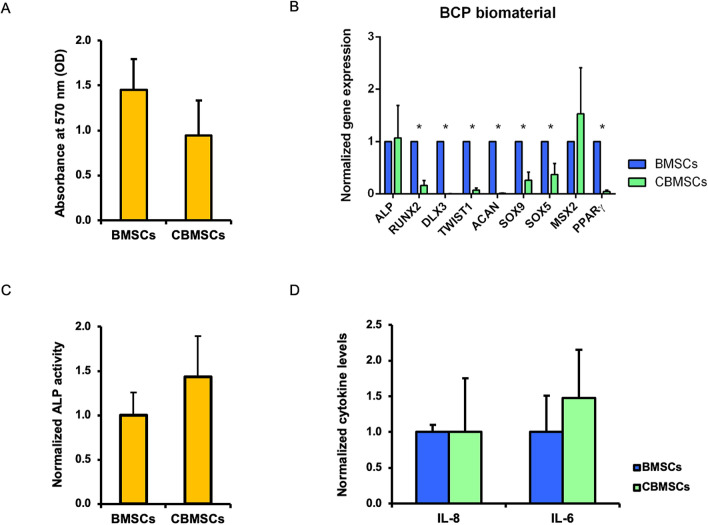
Figure 4.
Gene expression profiles and secretion properties of BMSCs and CBMSCs cultured on BCP biomaterial. (A) Histogram showing optical density (OD) at 570 nm as Mean ± standard deviation (SD). (B) Histogram showing gene expression of BMSCs and CBMSCs as Mean ± standard error of the mean (SEM) and normalized to BMSCs. (C) Histogram showing ALP activity as Mean ± SD and normalized to BMSCs. (D) Histogram showing levels of secreted interleukin (IL)-8 and IL-6 as Mean ± SD and normalized to BMSCs. Statistical analysis was by unpaired Student’s t-test. *Significant difference between MSCs of different tissue origin.

